the trading desk you build
The whole market, your way.
Build the desk your strategy needs: charts with 391 indicators, order flow, news and the journal on one screen, and, from launch, your own positions and P&L drawn on the same chart, straight from your broker account. SOOS, Visor's AI research engine, reads the filings, the flow and the price structure alongside you and reports what it finds — with the statistical honesty to say when a signal isn't there.
General information only — not advice. Capital at risk.

every trading day sounds like this
Most trading software shows you charts and leaves the thinking to you.
SOOS — the intelligence engine
One thing happens. You see it everywhere it matters.
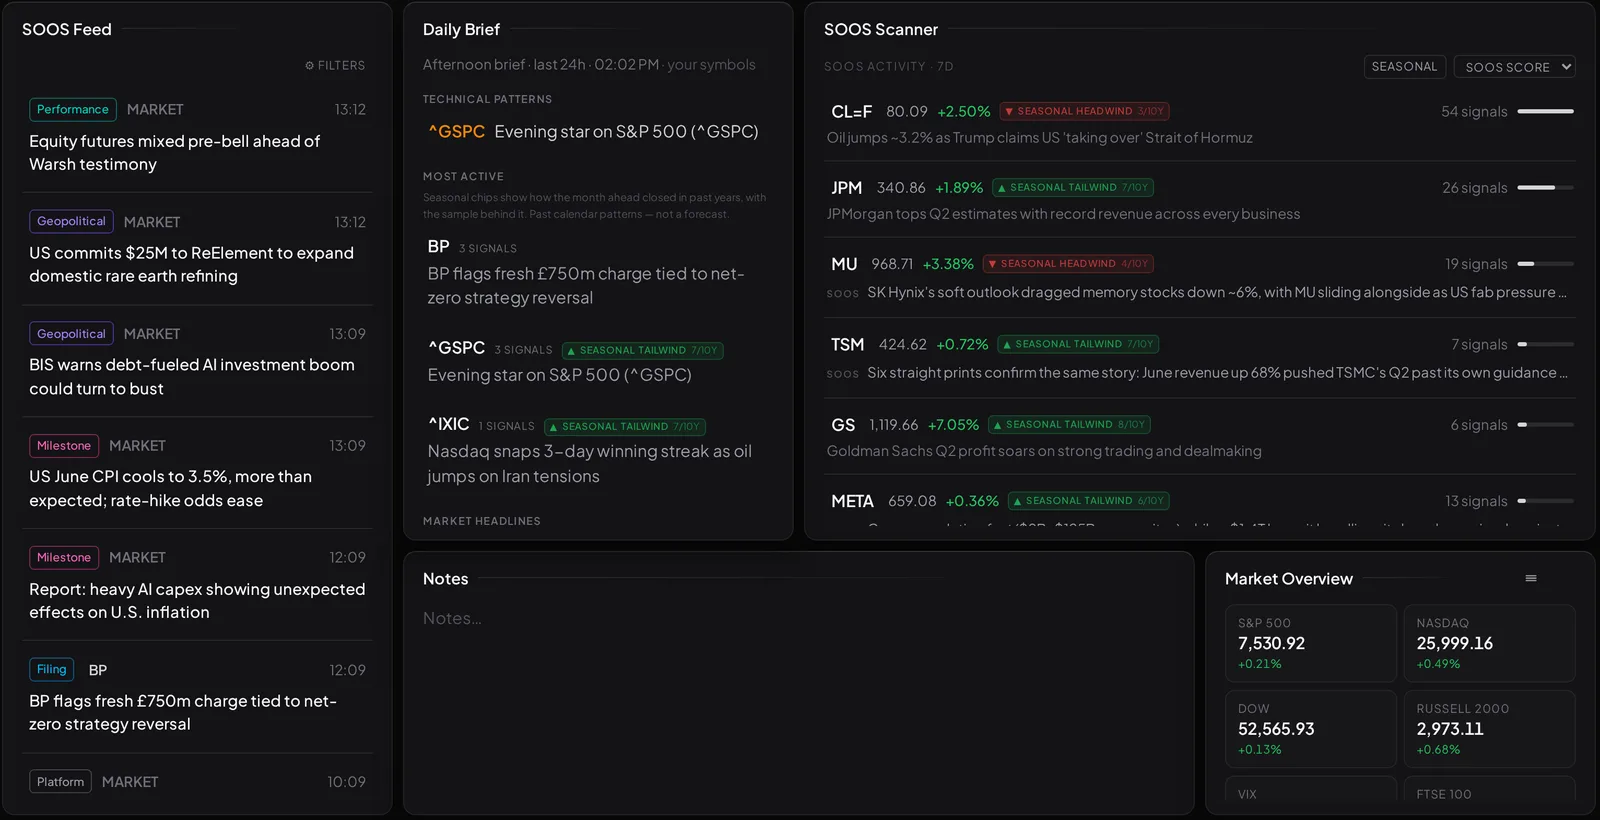
Everything Visor sees flows through SOOS, its intelligence engine — reading filings, contracts, news, and price structure around the clock. One detection becomes a feed entry, a scanner row, a line in tomorrow's brief, a marker on the exact candle, and a notification. In the app those surfaces carry its name: the SOOS Feed, the SOOS Scanner.
The Atlas desk in the app: the globe, news, congress trades and the calendar, with the SOOS desk inset. Real screen, real data. 3D imagery: Google.
ask it
Ask a question. It shows its working.
Ask SOOS about anything on your screen: a chart, a filing, a headline. It pulls the data, runs the numbers with real tools, and marks what it found on the chart, with every step it ran listed above the answer. Answers are metered in SOOS credits.
In the beta now; on every plan at launch.
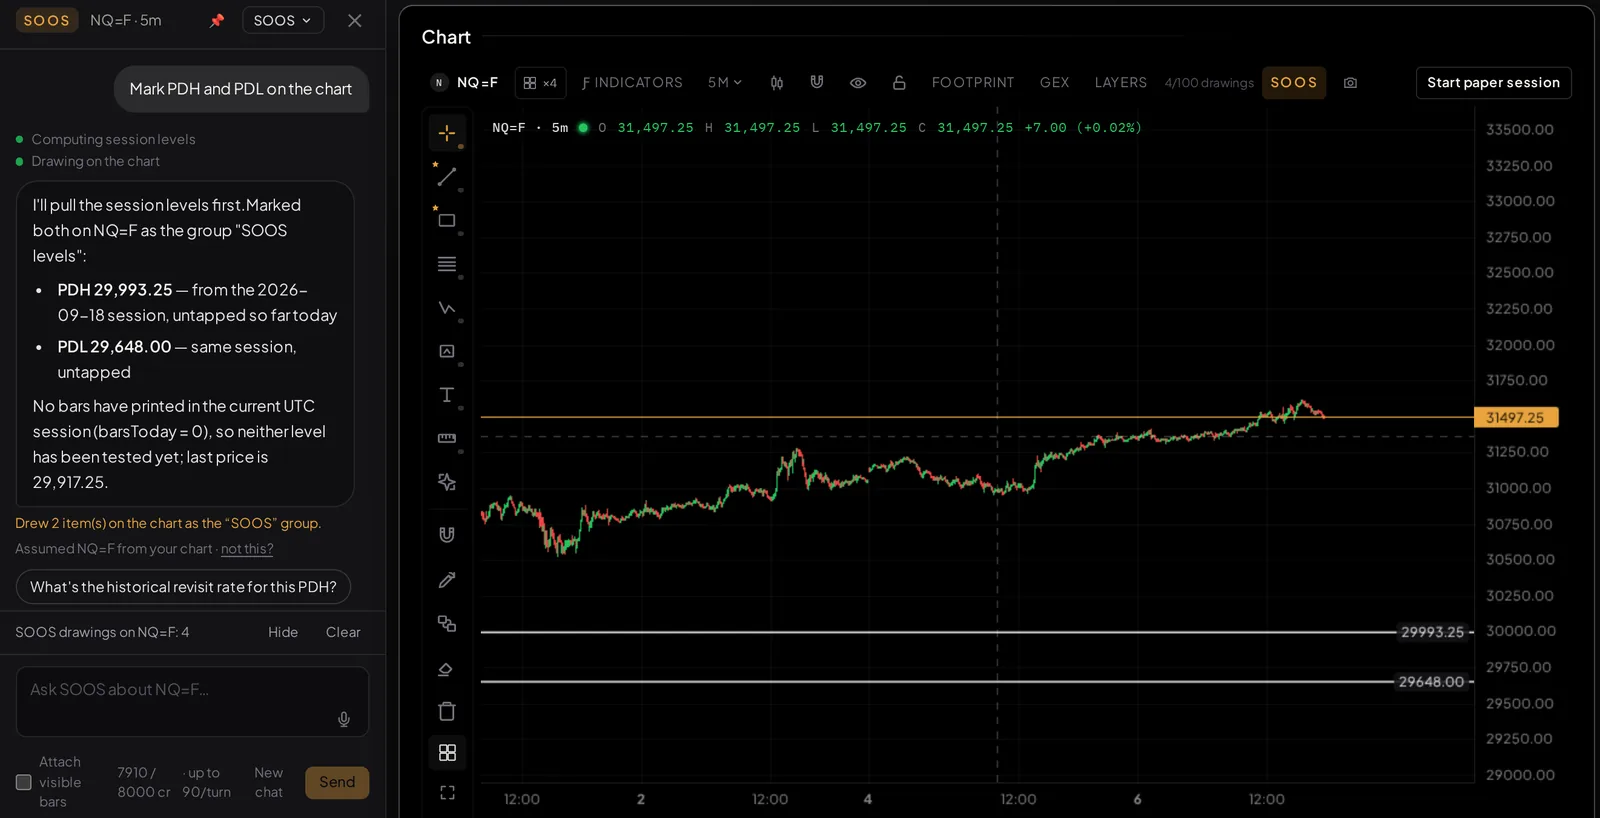
SOOS Chat in the app: a question, the tools it ran, and the marks it drew. Real screen.
one backtest, from our own test runs
+21.16%
total return
Beaten by randomly-timed entries averaging +27.51%.
Same entry signals, same spacing, same exit rule — only the timing was random.
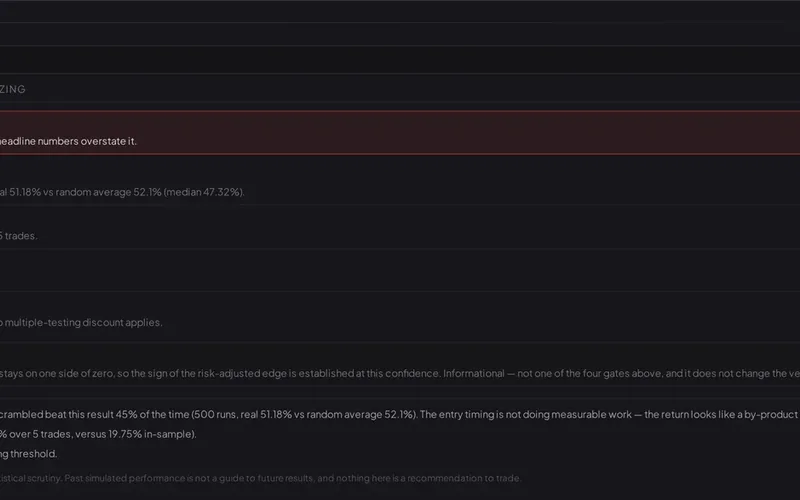
Every Visor backtest faces four gates. The verdict ships with the number — there is no setting to hide it.
- random control
- out-of-sample split
- t ≥ 3.5
- deflated Sharpe
Historical backtest results — not predictive.
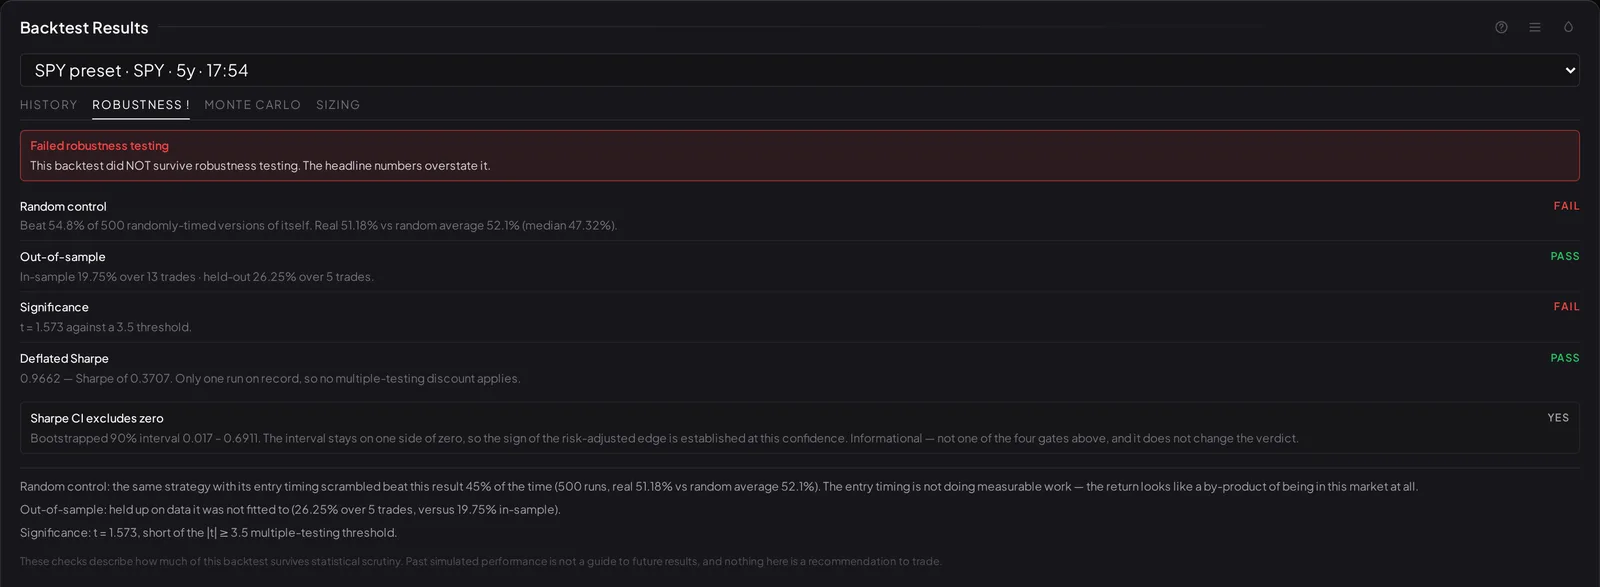
The real card for this run, in the app: the verdict ships with the number.
keyboard-first
Hands on the keys.
Eyes on the market.
workspace · Day tradingworkspace · Orderflowworkspace · Macro desk
Visor is built keyboard-first. Workspaces sit a keystroke apart — you rotate through desks the way a tiling window manager flips screens — and nearly everything is designed to answer to a key, so your hands stay on the keyboard and your eyes stay on the market.
More information per second — not more decoration.
The whole market, your way.
General information only — not advice. Capital at risk.
inside the product
See the flow, up close.
Everything below is a real screen from the running app — captured, not mocked.
orderflow
Footprint (orderflow)
Each candle opened into the volume that traded inside it — buys against sells at every price, the point of control marked on the ladder, delta and imbalance running in the footer. The kind of read futures order-flow traders use, shown here on live BTC tape: one-minute candles, recent candles footprinted from the exchange's own trades.
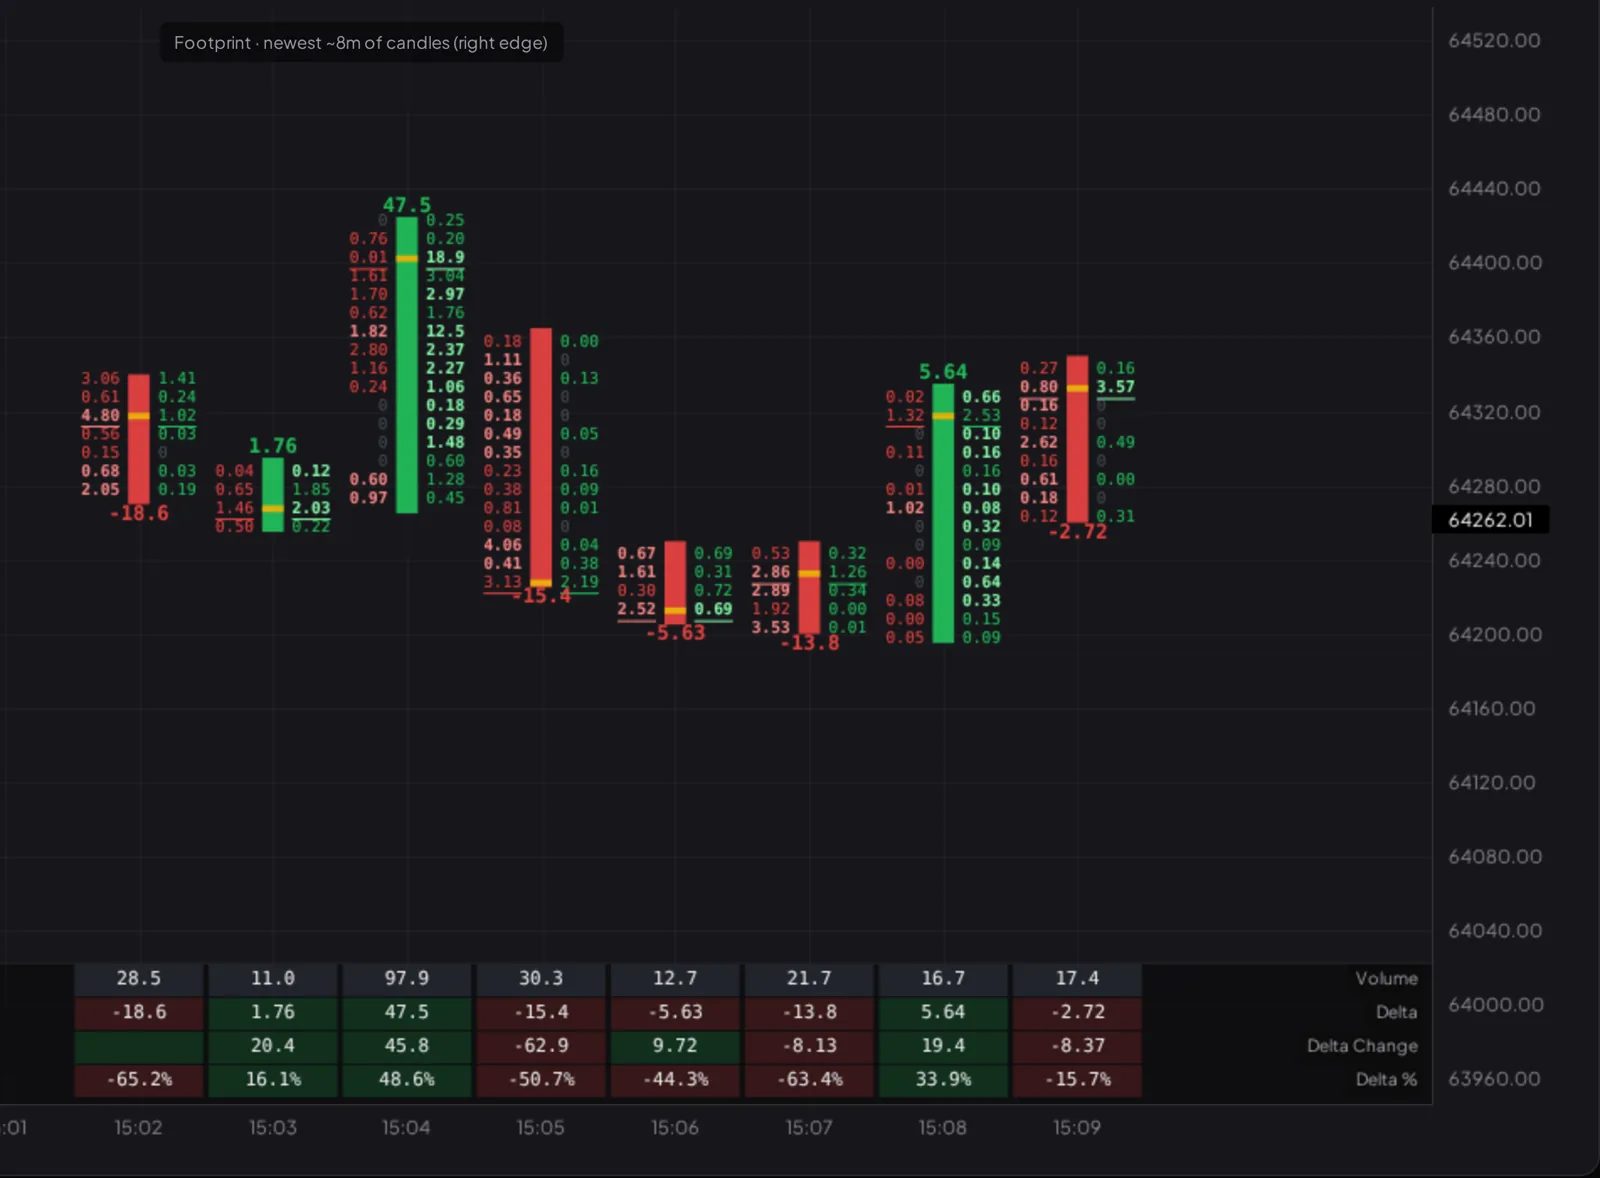
BTC-USD, one-minute footprint — real candles, real tape.
orderflow
Liquidity heatmap
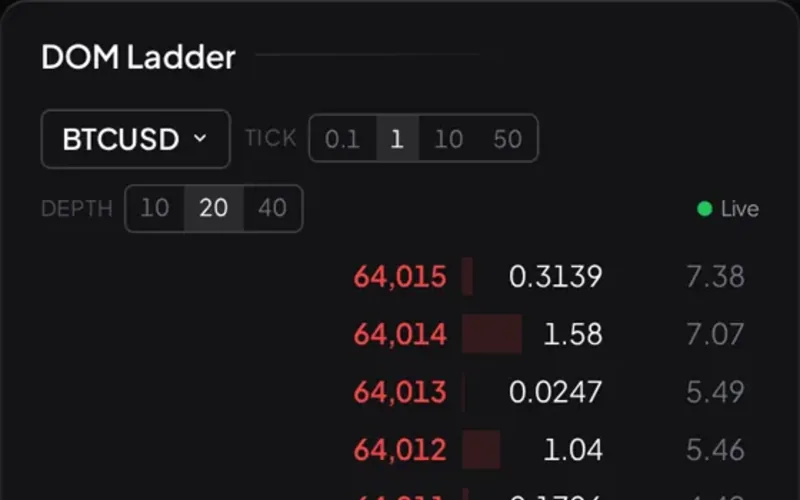
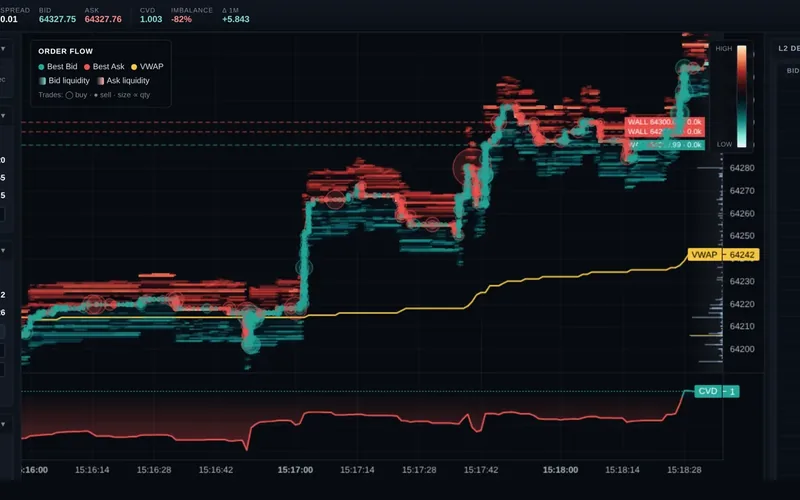
Resting depth painted across time — where the book stacks, where it pulls away, every print bubbled on top by size, VWAP and CVD over the window, the live level-2 ladder alongside. Fed by the same live stream as the DOM ladder, built to own a full screen — the kind of read futures and order-flow traders build a desk around, shown here on live BTC.
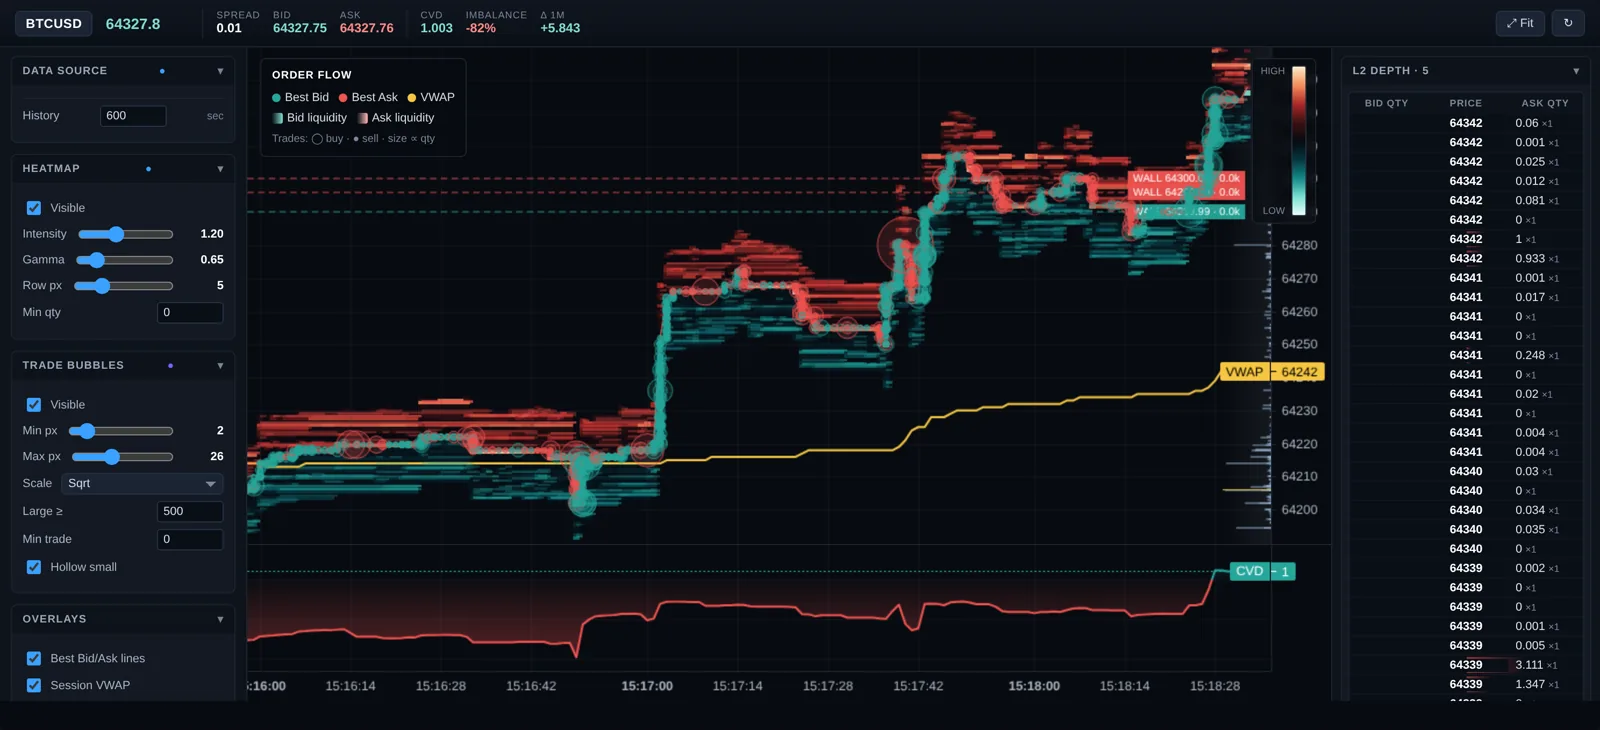
The order-flow map on live BTC — depth, prints, VWAP, CVD.
public records
Congress trades, with the number that matters
Every stock-trade disclosure filed by members of the US Congress, parsed from official House Clerk records — who filed, the ticker, the direction, the size band, and how long after the trade the public was allowed to know. The STOCK Act allows 45 days; Visor prints the actual lag on every row and flags the late ones.
Public records, presented as filed. Disclosures describe what happened weeks ago — Visor shows them for what they are, and never as something to act on.
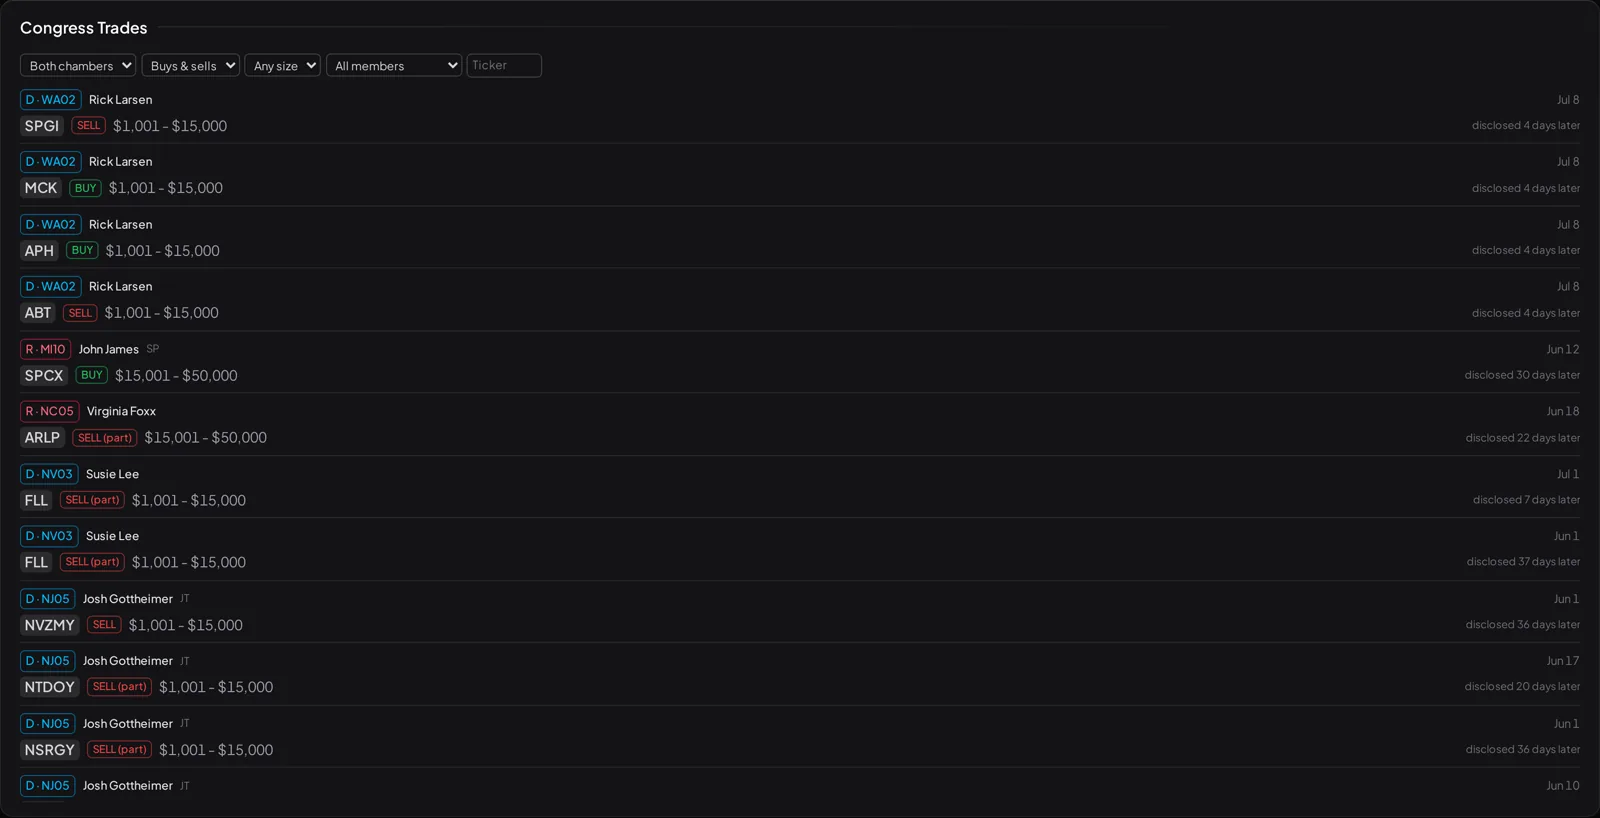
Disclosed 45 days later. Disclosed 1 day later. The lag is the story.
atlas
Atlas
A 3D globe, with photoreal imagery from Google, carrying the world's own data layers, each one toggleable: ships at sea live; earthquakes, storms and military aircraft refreshed hourly; power plants and refineries. Drag to spin.
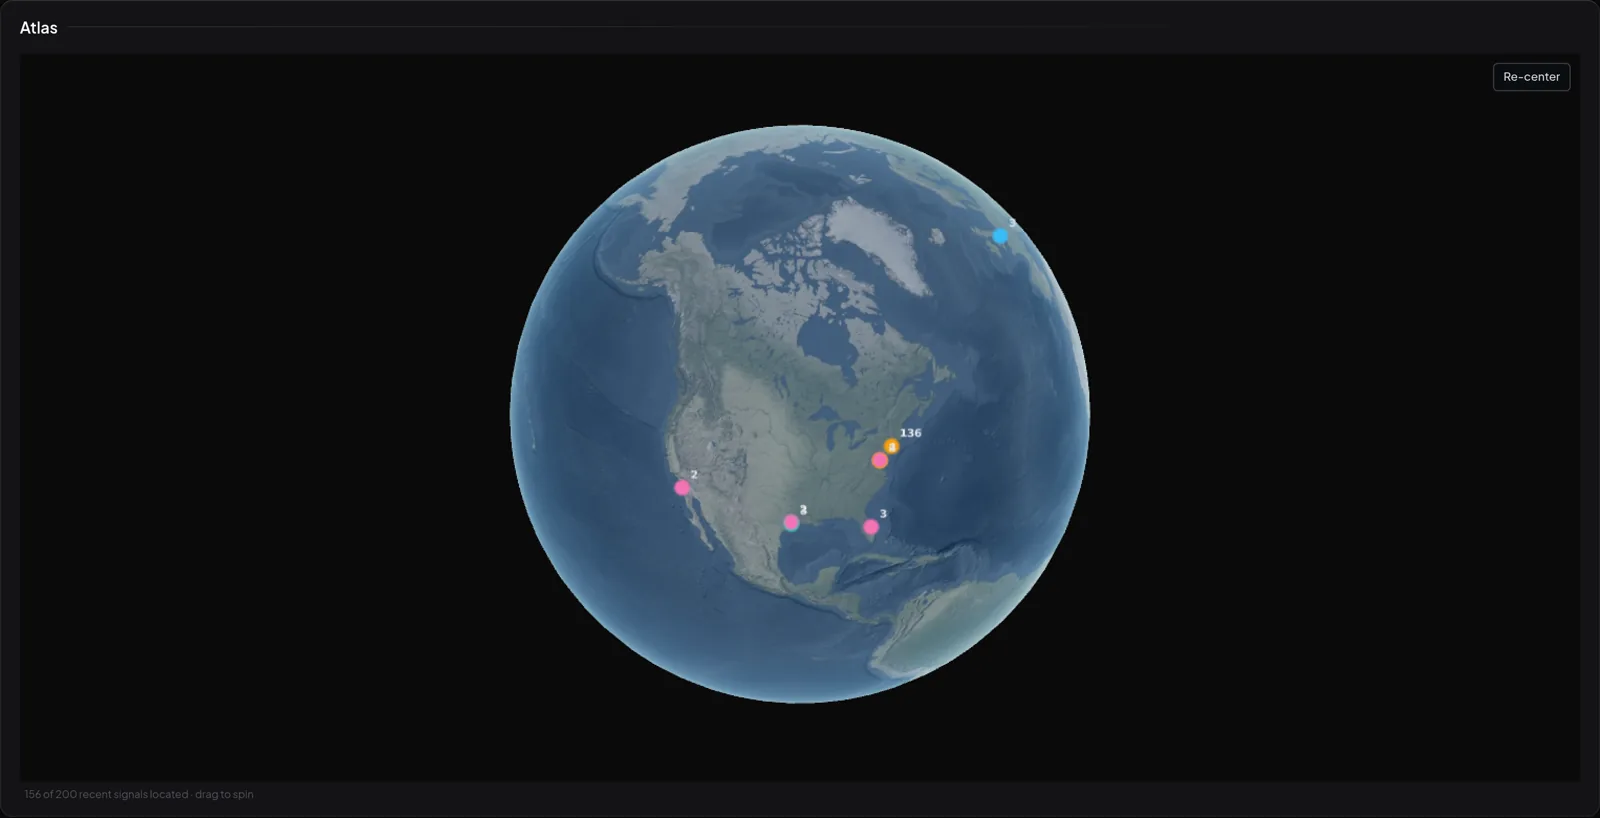
The world's own data, plotted on the planet it describes. 3D imagery: Google.
account sync
Your account, on the chart.
If your prop firm or broker issues Rithmic credentials that work with third-party platforms, they work with Visor. Account sync is rolling out now and arrives with launch.
01
Connect
Sign in with the Rithmic credentials your prop firm or broker already issued — the same login their other third-party platforms take. There is no new account to open. Rithmic support is built and in testing, and is not switched on yet.
02
See it on the chart
Your positions, working orders and fills draw directly on the Visor chart, with live P&L beside them — your trading day and the market on one screen, not two apps glanced between.
03
Journal, filled in
Every fill lands in the trading journal automatically. The record of what you actually did builds itself while you trade — nothing to type up after the close.
Read-only by construction: the order-entry code is physically excluded from the build, and an automated guard verifies the exclusion every time the code loads. Visor can read your account — it cannot touch it. Visor's Rithmic integration passed R|Protocol conformance on 24 August 2026; order entry switches on at launch, to your own account at your own broker or prop firm.
General information only — not advice. Capital at risk.
workspaces
Compose the desk yourself.
A workspace is a grid you build: drop widgets in, drag and resize them like a tiling window manager, and keep as many desks as your tier carries — three on Free, four on Starter, six on Pro, ten on Pro+. One-click presets lay out a first desk for you.
Thirty-two widget types are in the gallery today — charts, order flow, options analytics, quant studies, news, the trading journal, alerts, seasonality, congressional disclosures, the Atlas globe, the Learn library. Every tier can place every widget.
- Day trading
- Orderflow
- Macro desk
- or an empty grid
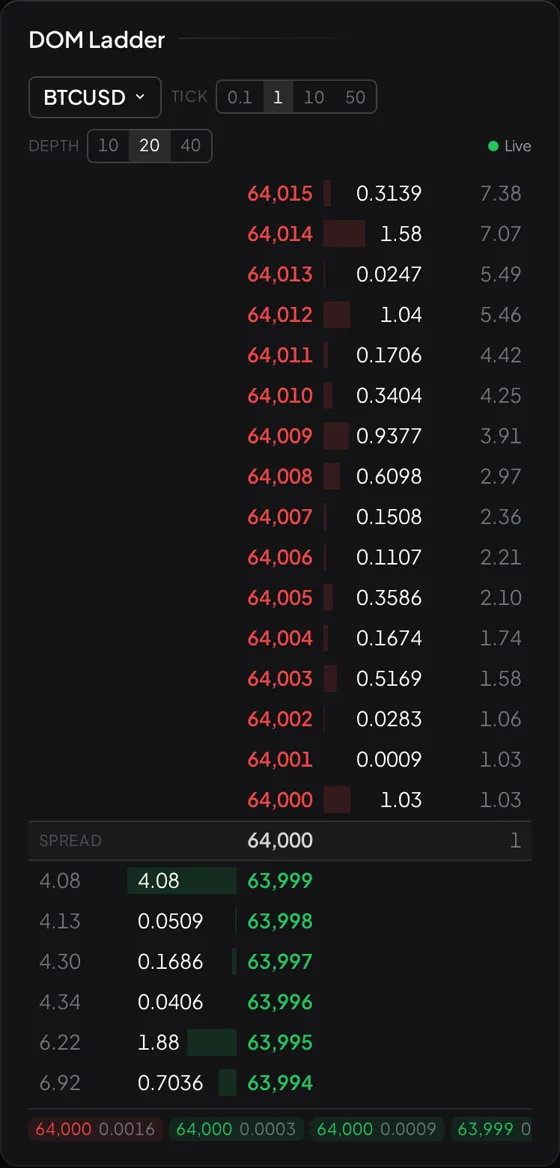
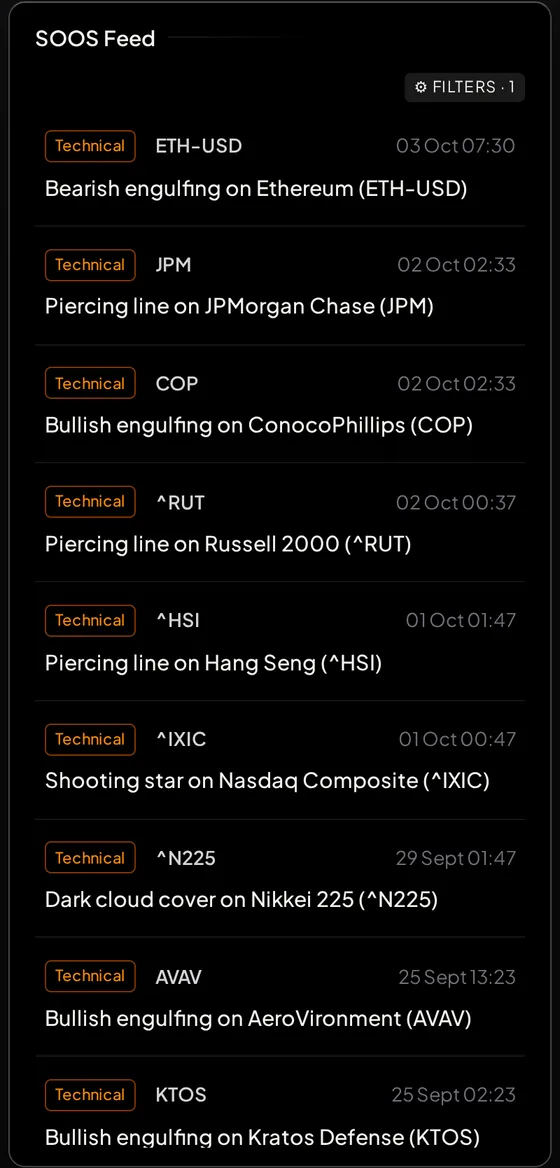
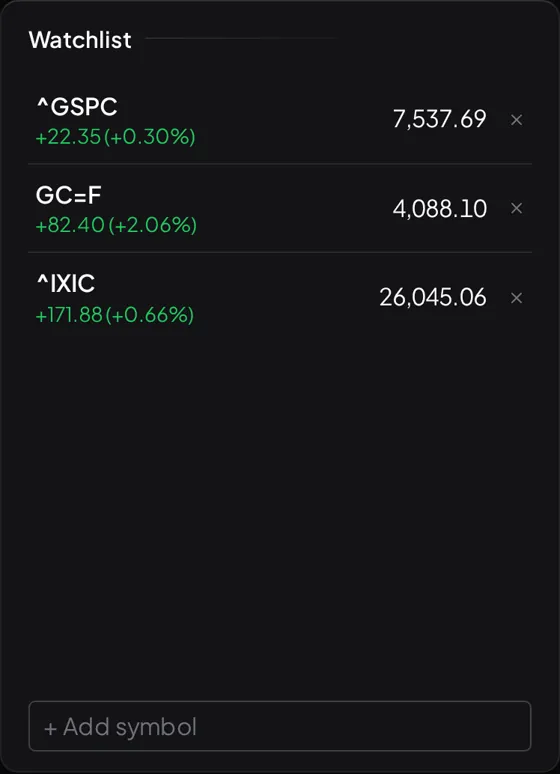
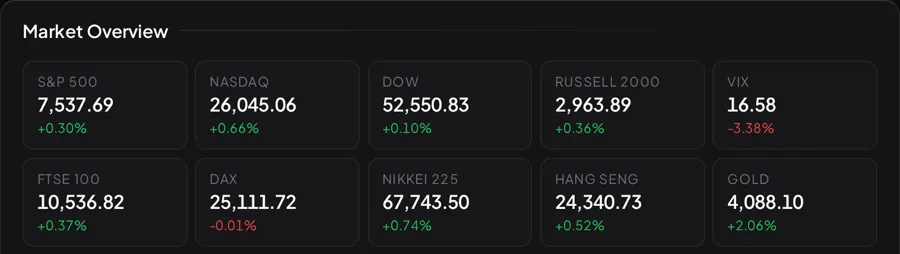
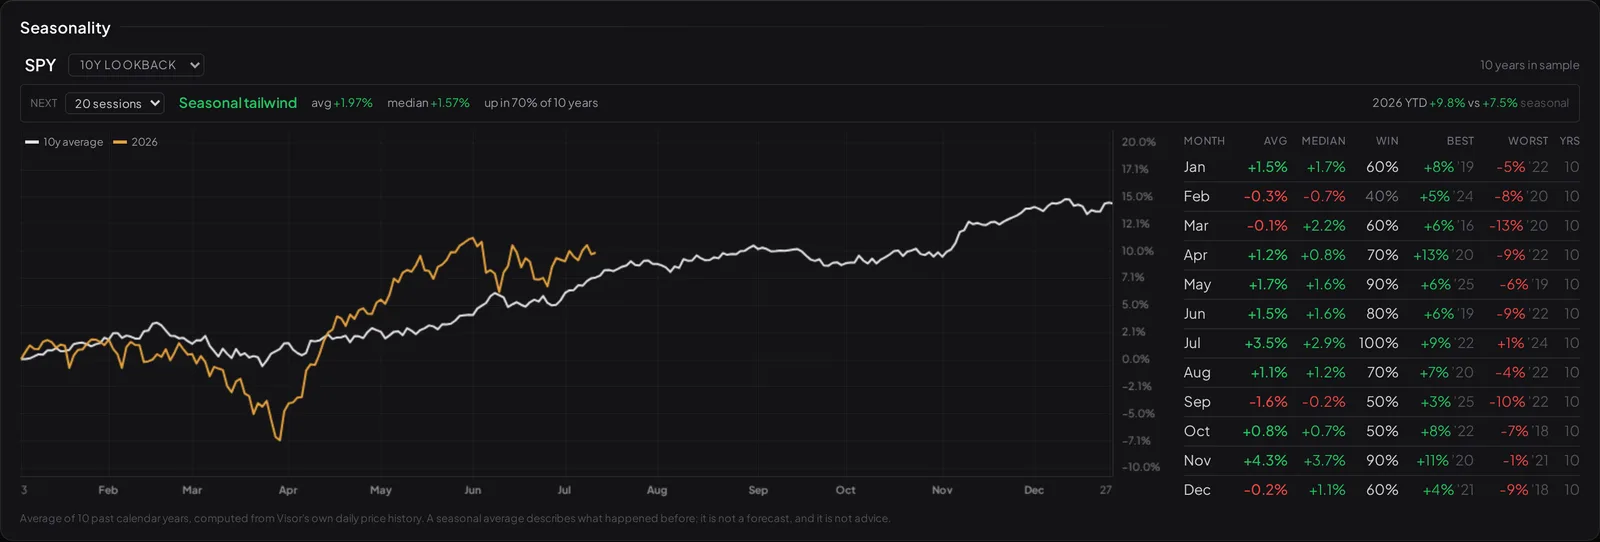
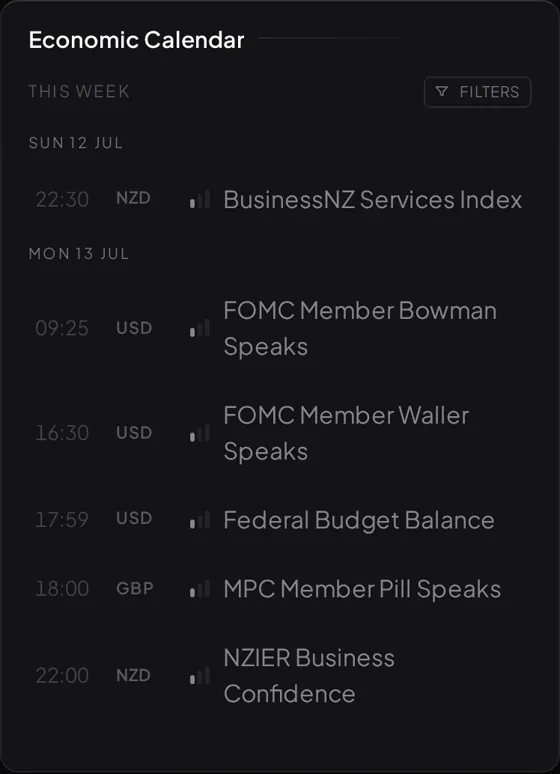
Real widgets, captured from a live workspace — not renders.
about
Everything you need to read the market, on one screen.
Visor carries the whole desk: real charts with 391 indicators, 62 pattern detectors, a full drawing rail and tiling workspaces — and, from launch, your own account drawn on them. At launch, connect the Rithmic credentials your broker or prop firm already issues and your positions, fills and P&L appear on the chart, with the journal filled in from your fills. Over it all runs SOOS, the intelligence engine, doing the reading on both fronts — the charts themselves (price structure, patterns, seasonality, volatility) and the world behind them (filings, contracts, news, congressional disclosures, research) — and reporting what it saw. Honestly, including when the honest answer is “nothing”.
Until order entry opens, that account connection is read-only: Visor reads your account, it cannot touch it — the order-entry code is excluded from the build and an automated guard enforces the exclusion, in code rather than policy. Order entry switches on at launch, to your own account at your own broker or prop firm.
The honesty is engineering, not copy. Every backtest faces four anti-overfit gates and the verdict travels with the headline number — there is no setting to hide a failing one. Every seasonal figure prints its sample size on itself, and a sample too thin to stand on gets silence instead of a confident-looking curve. Where a claim can't be supported, Visor says “not proven” — words most tools in this market are structurally unable to say.
It's made for people who trade their own money, follow their own set of instruments, and have been burnt by tooling that needed them excited. Visor states observations about the market, identical for everyone on a tier — it never tells you what to do. If you want to be told what to trade, this is the wrong tool. If you want a research desk that tells you the truth about the data, this is the one being built.
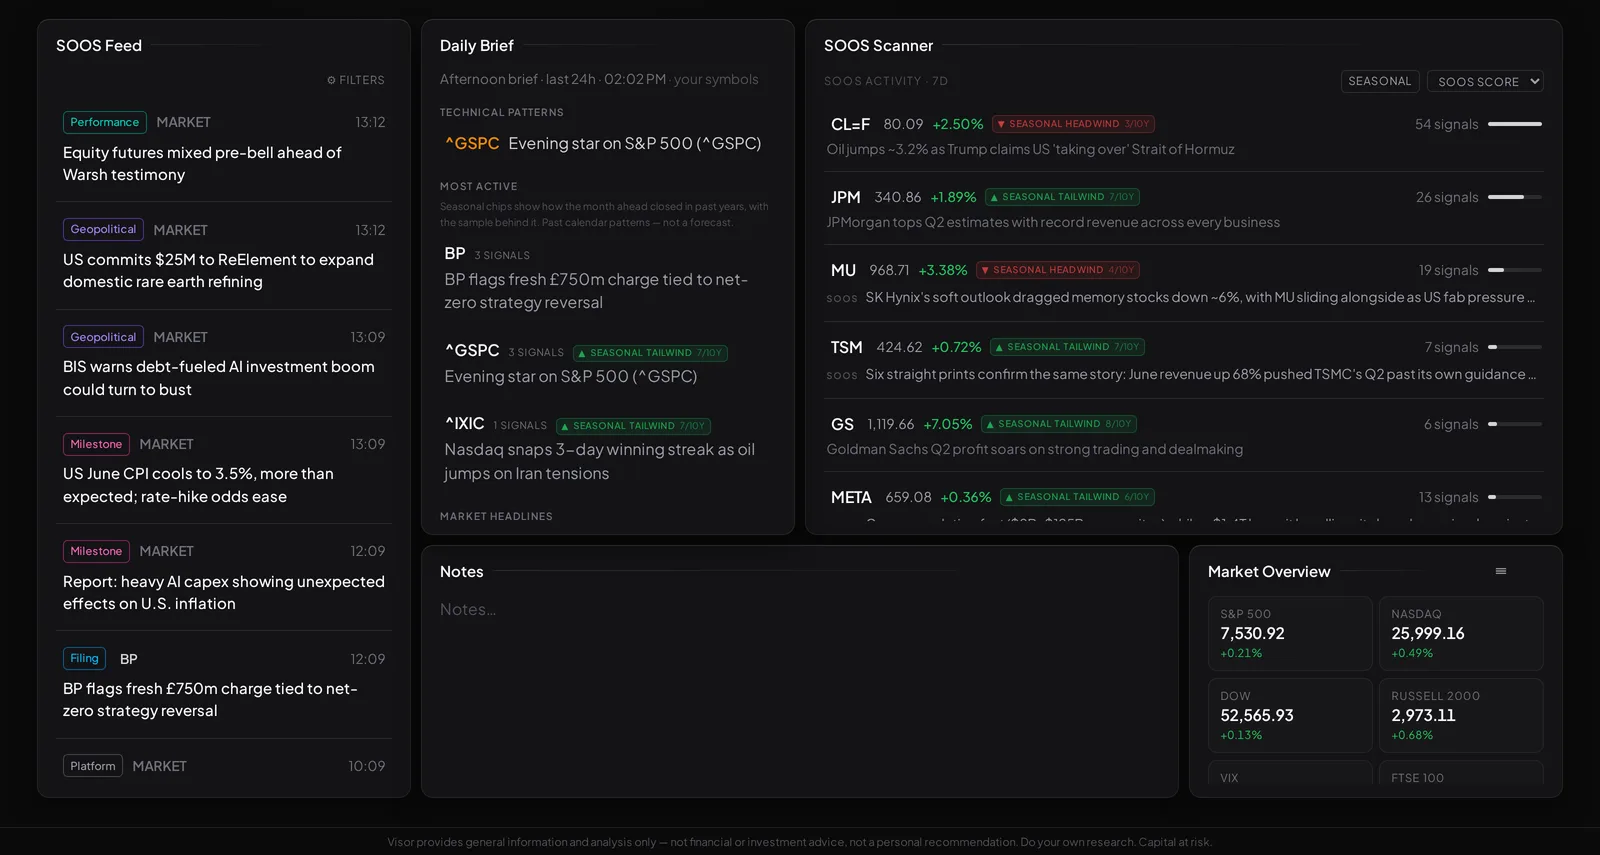
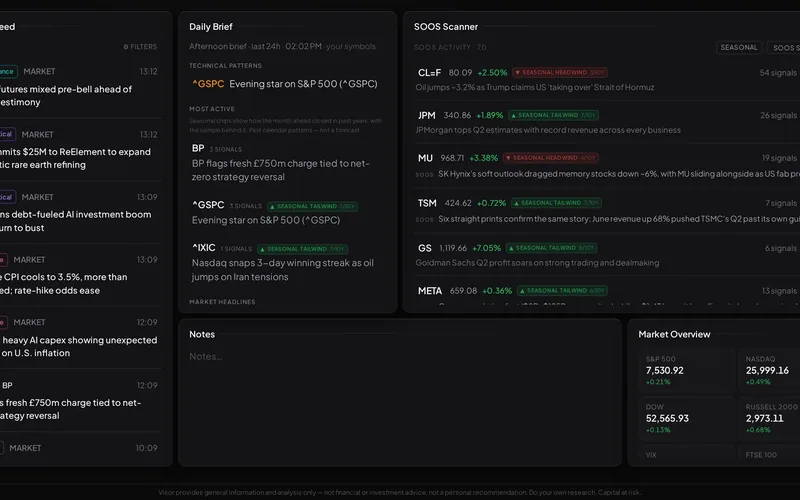
A real Visor desk — SOOS Feed, Daily Brief, and Scanner sharing one screen.
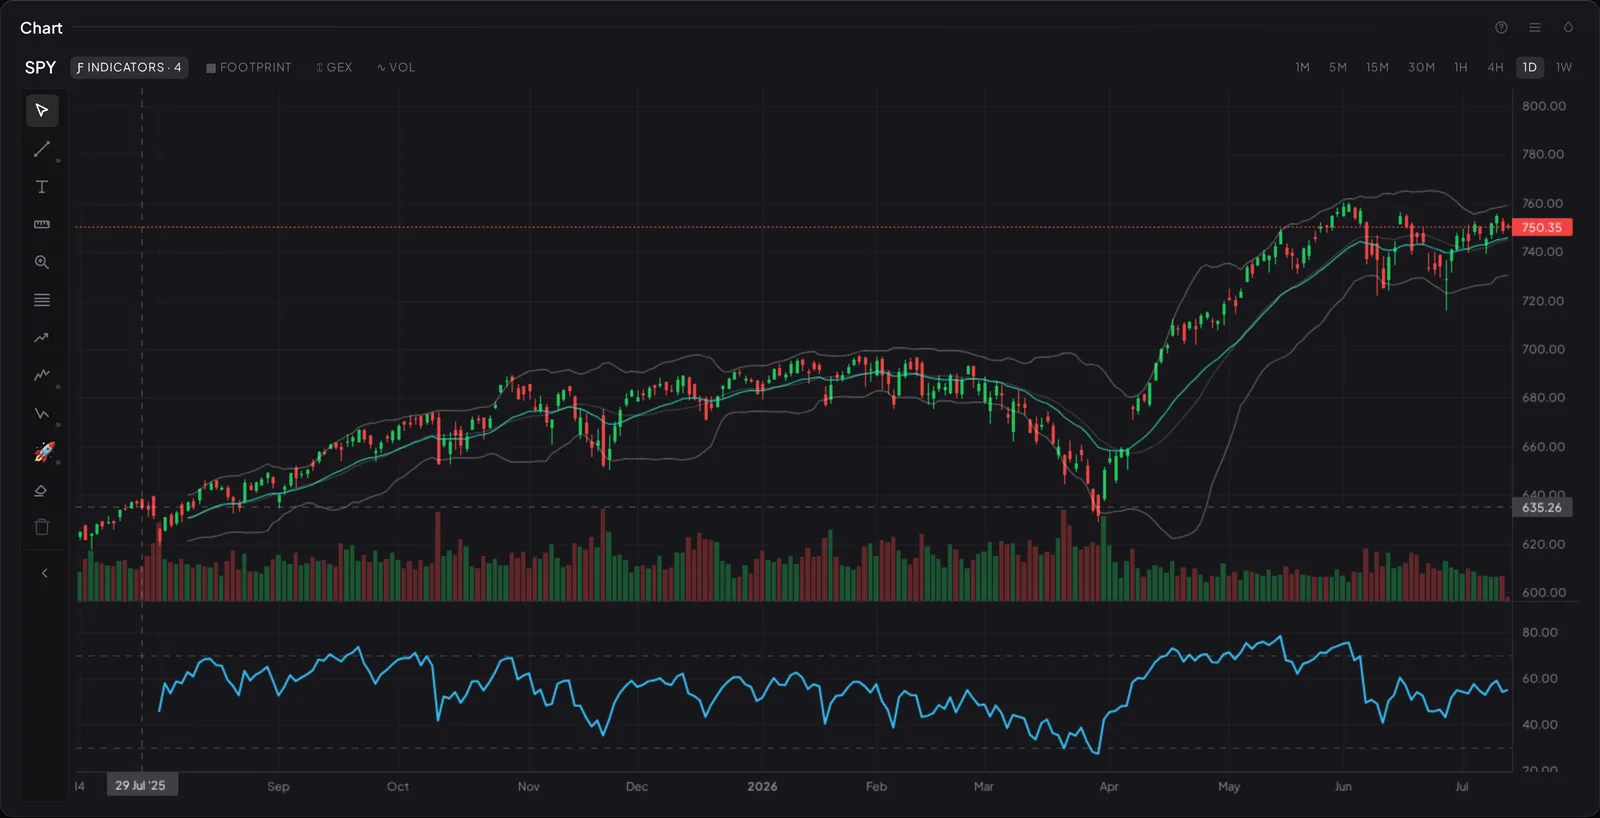
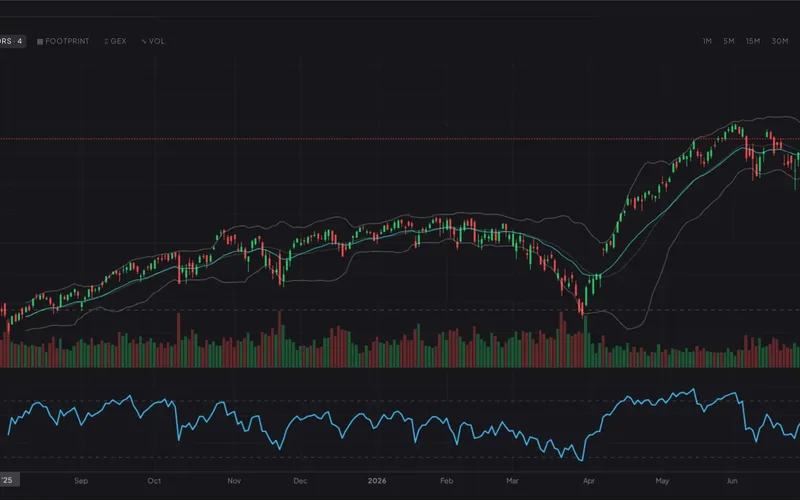
And the charts are first-class — up to eight per layout on Pro+, 391 indicators, 62 pattern detectors, a full drawing rail.
pricing
The tiers, as they exist in the app.
Free is genuinely usable — it starts with two pre-built desks at its workspace cap by design. Billing opens at launch.
What’s in it
- 2 workspaces
- 1 chart open at once
- 3 indicators per chart
- 1 of each order-flow window (DOM ladder, liquidity heatmap) · BTC and ETH
- 2 news widgets open at once
- 20 price alerts
- 750 SOOS credits a month
- 3 saved backtest strategies
Analysis
- BTC options: GEX profile, GEX ribbon, vol smile, greek surface: nearest expiry
- BTC options net premium flow: 1h window
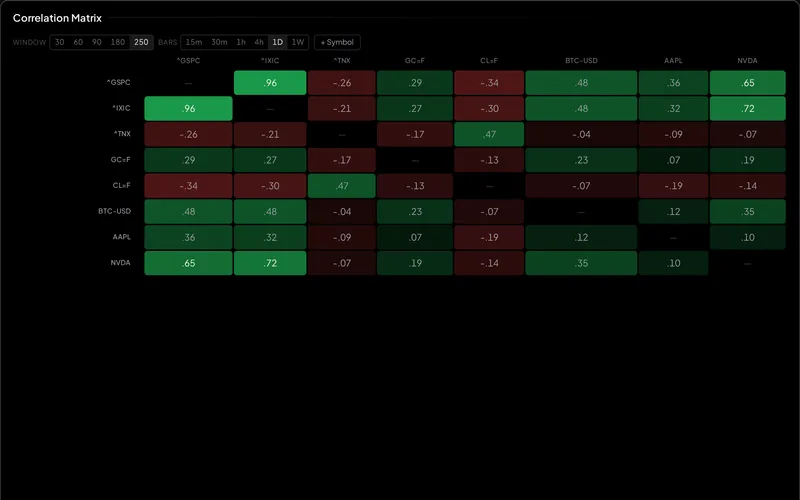
- Correlation matrix: 5 symbols
- Pairs analysis: 90-bar lookback
- 100 Monte Carlo paths per backtest
- Compare 2 strategies side by side
- Trading journal and calendar
- Learn library · 72 lessons across 8 tracks
Paid-tier data and tools, with smaller limits than Pro.
What’s in it
- 4 workspaces
- 2 charts open at once
- 5 indicators per chart
- 1 of each order-flow window (DOM ladder, liquidity heatmap) · BTC and ETH
- 4 news widgets open at once
- 40 price alerts
- 1,500 SOOS credits a month
- 5 saved backtest strategies
Analysis
- BTC options: GEX profile, GEX ribbon, vol smile, greek surface: every expiry
- BTC options net premium flow: 1h, 4h and 24h windows
- Correlation matrix: 20 symbols
- Pairs analysis: 500-bar lookback
- 2,000 Monte Carlo paths per backtest
- Compare 3 strategies side by side
- Trading journal and calendar
- Learn library · 72 lessons across 8 tracks
- Ad-free workspace
What you unlock
 Faster quotesNew on Starter
 ChartsAbove Free
 WorkspacesAbove Free
 Backtest depthAbove Free
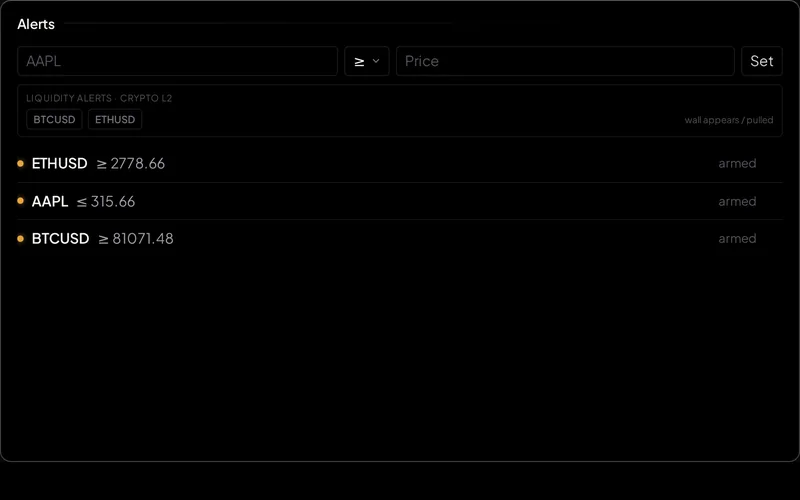 AlertsAbove Free
4 news widgets open at once across your workspaces, up from 2 on Free.
News widgetsAbove Free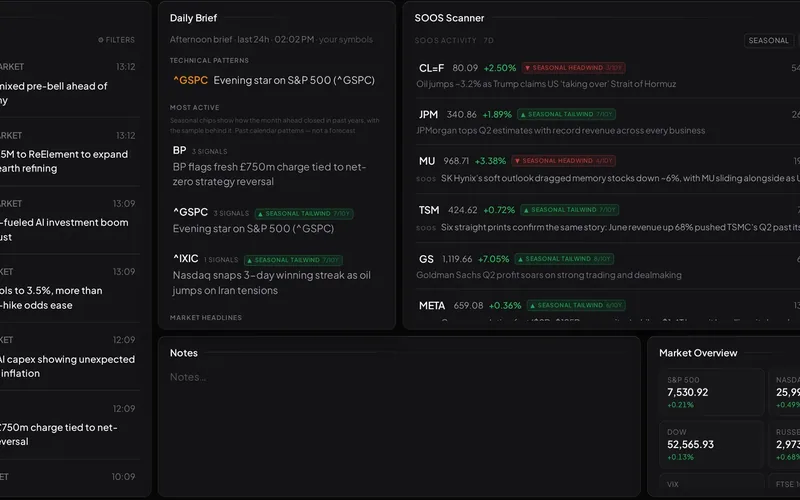 SOOS intelligence creditsAbove Free
Faster data and the full analytics toolkit for active traders.
What’s in it
- 6 workspaces
- 6 charts open at once
- 10 indicators per chart
- 2 of each order-flow window (DOM ladder, liquidity heatmap) · BTC and ETH
- 8 news widgets open at once
- 100 price alerts
- 4,000 SOOS credits a month
- 10 saved backtest strategies
Analysis
- BTC options: GEX profile, GEX ribbon, vol smile, greek surface: every expiry
- BTC options net premium flow: 1h, 4h and 24h windows
- Correlation matrix: 20 symbols
- Pairs analysis: 500-bar lookback
- 2,000 Monte Carlo paths per backtest
- Compare 4 strategies side by side
- Trading journal and calendar
- Learn library · 72 lessons across 8 tracks
- Ad-free workspace
What you unlock
- Faster quotesAbove Free
- ChartsAbove Free
- WorkspacesAbove Free
 Order-flow windowsAbove Free
- Backtest depthAbove Free
 Correlation and pairsAbove Free
- AlertsAbove Free
8 news widgets open at once across your workspaces, up from 2 on Free.
News widgetsAbove Free- SOOS intelligence creditsAbove Free
The most room to build and the largest intelligence allowance.
What’s in it
- 10 workspaces
- 15 charts open at once
- 25 indicators per chart
- 4 of each order-flow window (DOM ladder, liquidity heatmap) · BTC and ETH
- Unlimited news widgets open at once
- 400 price alerts
- 8,000 SOOS credits a month
- 20 saved backtest strategies
Analysis
- BTC options: GEX profile, GEX ribbon, vol smile, greek surface: every expiry
- BTC options net premium flow: 1h, 4h and 24h windows
- Correlation matrix: 20 symbols
- Pairs analysis: 500-bar lookback
- 2,000 Monte Carlo paths per backtest
- Compare 20 strategies side by side
- Trading journal and calendar
- Learn library · 72 lessons across 8 tracks
- Ad-free workspace
What you unlock
- ChartsAbove Pro
- WorkspacesAbove Pro
 Order-flow windowsAbove Pro
- Saved strategiesAbove Pro
- AlertsAbove Pro
Unlimited news widgets open at once, raising Pro's 8.
News widgetsAbove Pro- SOOS intelligence creditsAbove Pro
Market data
Included with every plan
- Quotes refresh every minute on paid plans. Free: quotes and charts refresh on a 15-minute delay.
- FX is a daily reference rate.
- Futures quotes are delayed today.
- BTC and ETH order flow streams live.
- BTC options analytics.
- Company financials from SEC filings (paid plans).
Bring your ownAt launch
- Connect the Rithmic login your broker or prop firm issues; live futures data then comes through your own account. Visor does not charge for it.
BuyAt launch
- Live futures and US stock data packages, on their own or bundled with a plan, priced per trader.
Prices in USD or GBP; charged in the currency you choose at checkout. Tier limits are enforced server-side in the app; the full comparison matrix lives in the product. Why Visor costs what it does.
learn
Built to teach you, not to sell you.
A guided lesson library ships inside Visor — 72 lessons across eight tracks, written to the same honesty register as the product: observations, never instructions; historical figures always labelled non-predictive. Lessons on every widget, every signal, and how markets actually work — what a tool can tell you, and what it can't.
The Strategies track takes the material sold in expensive courses — order blocks, fair value gaps, liquidity sweeps, the golden cross — runs each mechanical rule through the four anti-overfit gates on real data, and prints the engine's own verdict at the end of the lesson. Nobody selling a strategy course shows you the held-out half; the library leads with it.
- Getting Started
- Market Basics
- Reading the Tape
- Strategies
- Quant Methods
- Options
- Risk & Psychology
- Using Visor
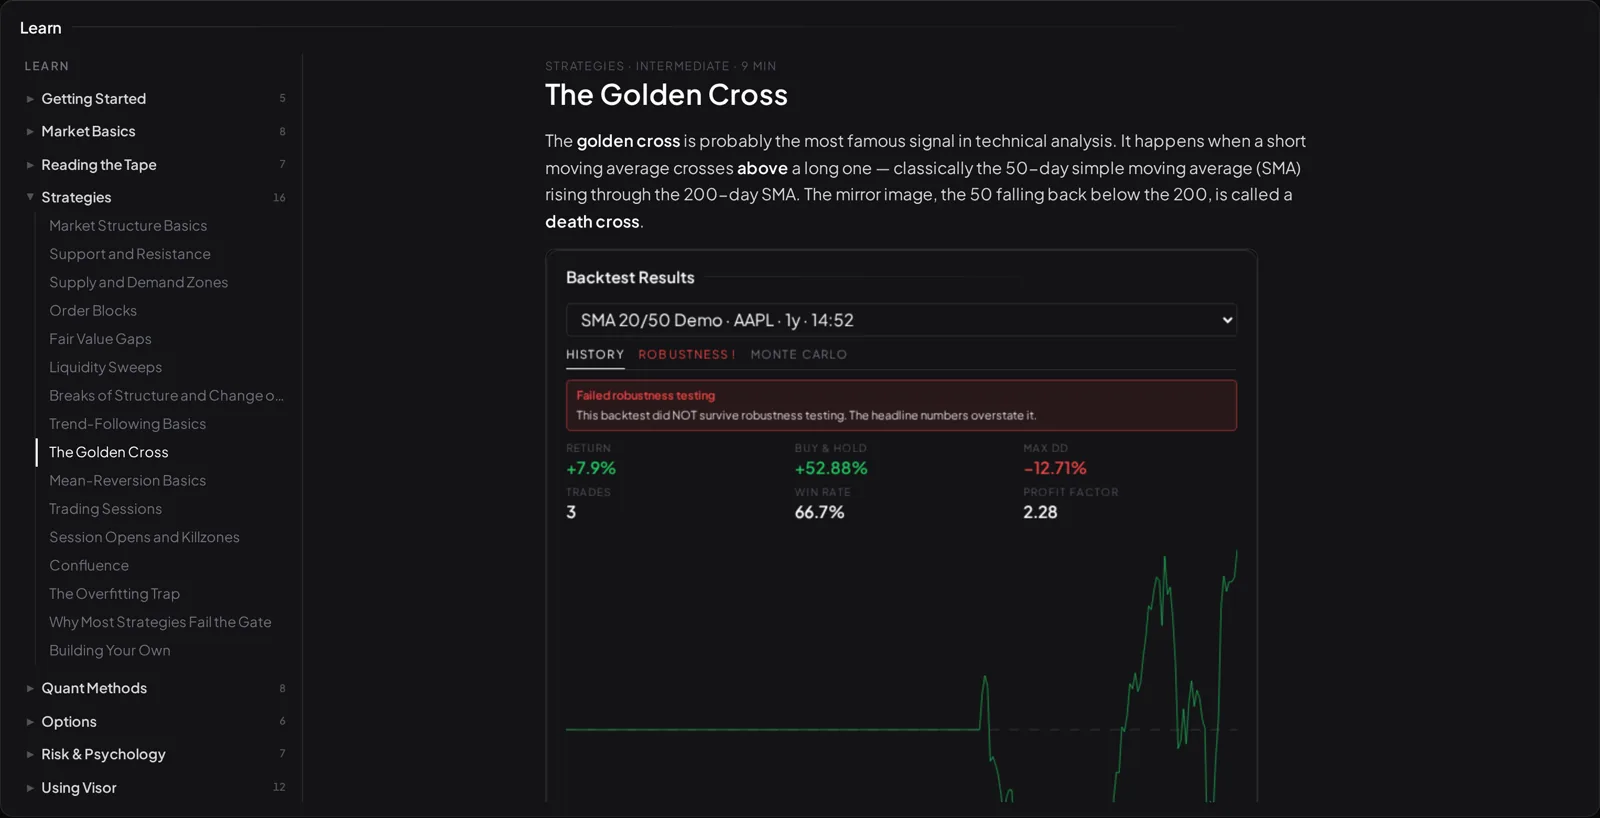
The Golden Cross, open in the app. The engine's own verdict on the most famous signal in technical analysis: failed robustness testing — printed in the lesson, not hidden under it.
faq
Fair questions.
Is this financial advice?+
No. Visor provides general information and analysis only. It states observations about the market — identical for everyone on a tier — and never tells you what you should do. It is not financial, investment, or trading advice, is not a personal recommendation, and does not consider your individual circumstances. Do your own research. Capital at risk.
Will Visor tell me what to trade?+
No, deliberately. Signals describe the market, never instruct the user — no entries, stops, or targets as guidance, ever. If you want to be told what to trade, Visor is the wrong tool.
What is SOOS?+
SOOS is Visor's intelligence engine — the pipeline that reads filings, contracts, news, congressional disclosures, and research around the clock, and analyses the charts themselves: price structure, chart patterns, seasonality, and volatility across the instruments you follow. What it sees becomes the SOOS Feed, the SOOS Scanner's per-row reads, and the Daily Brief. Its analysis is AI-generated and labelled as such in the app, and it can be incomplete or wrong — which is why every claim travels with its source and its sample size. It states observations about the market, never recommendations.
What are the four anti-overfit gates?+
Every backtest is checked against: a random control (500 randomly-timed twins with the same trade count, spacing, and exit rule), an out-of-sample split (70/30 by time, never randomly), corrected statistical significance (|t| ≥ 3.5 after Harvey–Liu–Zhu, not the naive 2.0), and a deflated Sharpe ratio. The verdict ships with the headline number, and there is no setting to hide a failing one. All results are historical and non-predictive.
Where does the data come from?+
SEC EDGAR filings, US defence contract awards from USAspending, per-ticker and market-wide news, arXiv quantitative-finance research, and US congressional trade disclosures parsed from official House Clerk public records — plus a 12-pattern server-side scanner and price history from third-party market-data sources, served through Visor. Seasonality and volatility figures are computed in-house from that history.
Is there a free tier?+
Yes, and it's genuinely usable: two workspaces (seeded as two pre-built desks), 15-minute delayed quotes, 750 SOOS intelligence credits a month, and the full Learn library. Paid plans (Starter, Pro and Pro+) add faster quotes than Free, more room, and larger allowances. On every plan, FX is a daily reference rate, futures quotes are delayed today, and BTC and ETH order flow streams live.
Does Visor cover crypto?+
As read-only data and analysis only — BTC appears on charts and in scanner reads like any other instrument. Visor never promotes cryptoassets or invites you to acquire them.
Does it replace TradingView?+
Visor is built to put everything you need to read the market on one screen. The charts are serious — 391 indicators, 62 pattern detectors, a full drawing rail, tiling workspaces — SOOS reads the price structure behind them as well as the news around them, and, from launch, your own account draws on the chart through read-only broker sync. Orders themselves are still placed at your broker today; order entry inside Visor switches on at launch.
Can I connect my broker or prop-firm account?+
Yes — via Rithmic. If your prop firm or broker issues Rithmic credentials that work with third-party platforms, you'll be able to connect them to Visor: your positions, working orders, fills and P&L draw on the chart, and the trading journal fills itself from your fills. The connection is read-only by construction — Visor can read your account and cannot place, modify or cancel anything. Rithmic support is built and in testing; it is not switched on yet, and we'll announce it here when it is.
Can I place trades in Visor?+
Not yet. Today the account connection is read-only: Visor reads your positions, orders and fills, and cannot place, modify or cancel anything — the order-entry code is excluded from the build and an automated guard enforces that in code, not policy. Visor's Rithmic integration passed R|Protocol conformance on 24 August 2026; order entry switches on at launch, to your own account at your own broker or prop firm.
What happens when I join the waitlist?+
Your email is stored, and you get one email when access opens. No marketing sequence, no countdowns.