Strategies · intermediate · 9 min
The Golden Cross
The golden cross is probably the most famous signal in technical analysis. It happens when a short moving average crosses above a long one — classically the 50-day simple moving average (SMA) rising through the 200-day SMA. The mirror image, the 50 falling back below the 200, is called a death cross.
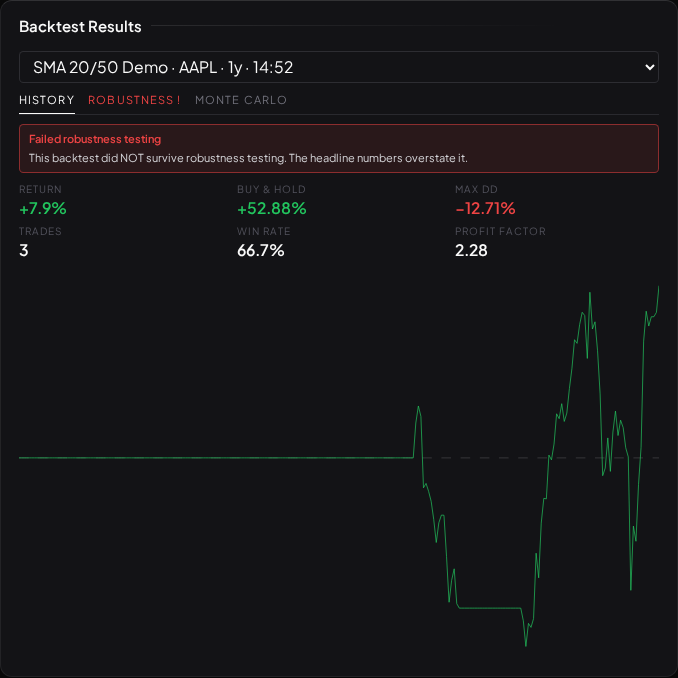
The story attached to it is simple: the average price over the last fifty days has overtaken the average over the last two hundred, so the recent trend is stronger than the long one, and momentum has turned up. It gets written up in the financial press every time it appears on a major index.
This lesson does something the press rarely does. It runs the golden cross on real data and then puts the result through Visor's robustness engine — the same four gates every backtest in the app is measured against. The point is not to tell you to trade it or avoid it. The point is to show you how to tell the difference between a signal that carries information and a number that just looks impressive.
What the rule is
Expressed as a mechanical rule with no discretion:
- Entry: the day the 50-day SMA closes above the 200-day SMA.
- Exit: the day the 50-day SMA closes back below the 200-day SMA (the death cross).
That is exactly the strategy baked below — an sma_cross entry with fast: 50, slow: 200 and an opposite-cross exit — run on SPY (the S&P 500 ETF) over the last five years of daily bars. You can load this precise configuration into the Strategy Editor at the end and run it yourself.
What happened, historically
Over the five-year window baked here, the golden cross fired and reversed just twice. Held long between each cross and the next death cross, it returned about +60%. That is a large number in isolation — and it is the number that would get quoted.
Two things immediately complicate it:
- Simply buying and holding SPY over the same window returned about +73%. The famous signal, on this window, made less than doing nothing — because it sat in cash for the roughly third of the time it was flat, including some of the rise.
- Two trades in five years is a very small sample. Almost nothing can be proven from two data points, however large the return next to them looks.
Neither of those is visible if you only read the headline return. The robustness gates make them explicit.
The honest verdict
Here is the baked robustness report for this exact strategy and window. It is computed once, at build time, by the same engine the app runs on every backtest — read How to read a robustness report if the four gates are unfamiliar.
Random control
Beat 87% of 500 randomly-timed versions of itself (real 60.37% vs random average 36.89%).
Out-of-sample
Too few trades to compare (1 in-sample, 1 out).
Significance
Too few trades to compute a t-statistic.
Deflated Sharpe
Not enough trades to estimate a Sharpe.
These checks describe how much of this backtest survives statistical scrutiny. Past simulated performance is not a guide to future results, and nothing here is a recommendation to trade.
The headline that matters is the random control. The engine re-ran the identical strategy 500 times with its entry timing scrambled — same number of trades, same exit rule, same market, only the alignment between the crossover and the price destroyed. The real 60% return beat only about 87% of those randomly-timed versions, short of the 95% bar the gate requires, and roughly 1 in 8 scrambled versions did better. In plain terms: on this window, the crossover's timing was not doing measurable work. Being long a rising market for two-thirds of the time was doing the work, and a coin-flip on when to be long did nearly as well.
The other gates return not proven rather than pass or fail — with only two trades, there is not enough data to run the out-of-sample split or the significance test honestly, and the engine says so instead of inventing a verdict.
What to take from it
None of this means the golden cross is worthless, and none of it is a suggestion about what you should do with it. What the exercise shows is a method: a strategy's headline return is the number people read, and it is the least reliable thing about it. The questions that matter are whether the timing beats a scrambled version of itself, whether it survives on data it was not measured on, and whether the sample is large enough to mean anything at all. On this window, the golden cross answers "not clearly", "unknown", and "no".
That is the lens Visor applies to every strategy in this track. A signal is interesting when it beats its own random control — not when it simply beats zero in a market that went up.
Try it yourself
Load this exact configuration into the Strategy Editor, run it, and open the Robustness tab on the result. You will see the same gates, computed live on the current data.