Quant Methods · advanced · 9 min
Cointegration and Pairs
Correlation tells you whether two markets move together day to day. It says nothing about whether they stay together over time. Two names can be 0.97 correlated on daily returns and still drift hundreds of points apart in price. Cointegration is the stronger, rarer property that pairs trading is actually built on: not that two series move together, but that a particular combination of them is tethered — pulled back whenever it strays. Visor's Pairs Analysis widget runs the full test for one pair, and this lesson walks through what it does.
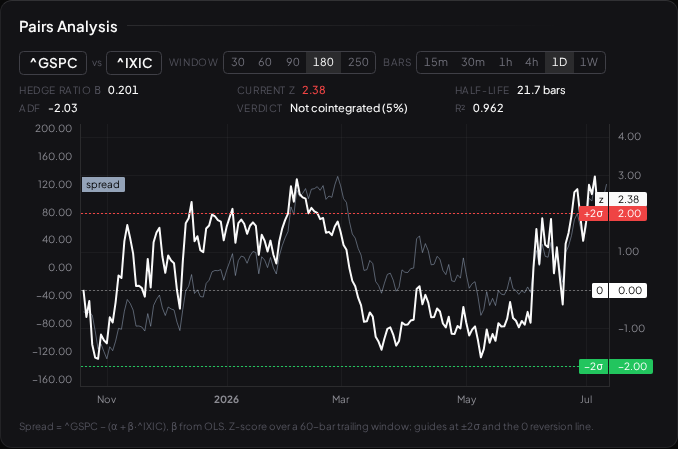
The idea: a tethered spread
Take two prices, A and B. Individually each wanders — trending, drifting, going nowhere in particular. But suppose the quantity
spread = A − β·B
stays roughly flat, drifting away from its average and then being pulled back, over and over. If it does, A and B are cointegrated, and that spread is the thing a pairs trader watches. The claim is not "A goes up" or "B goes up" — it is "when the spread stretches unusually wide, it has historically snapped back." That is a relative statement, indifferent to whether the whole market rises or falls.
The Engle-Granger procedure, step by step
Pairs Analysis runs the classic Engle-Granger two-step method:
- Cointegrating regression. Fit
A = α + β·Bby ordinary least squares. The slope β is the hedge ratio — how many units of B it takes to offset one unit of A. The regression's residual is the spread. - Test the spread for mean reversion. Run an Augmented Dickey-Fuller (ADF) test on that residual. ADF asks whether the spread is stationary — pulled back to a mean — or whether it wanders freely like a random walk. A strongly negative ADF statistic is evidence of the tether; a value near zero says "this spread wanders, there is nothing to revert to."
Alongside these, the widget charts the spread's rolling z-score — how many standard deviations it currently sits from its own recent mean — with ±2σ guides and the zero reversion line, and reports the half-life of reversion, covered in Mean Reversion and Half-Life.
Why the verdict is deliberately harsh
Here is the subtle, honest part. The cointegrating vector β was estimated from the very same data the ADF test then runs on. That matters enormously. If you test estimated residuals against the plain Dickey-Fuller critical values, the test over-rejects — it "finds" cointegration far too readily, because the regression already worked to make the residual look mean-reverting. It is the same family of mistake as judging a strategy on the data it was tuned on, which The Overfitting Trap covers in full.
Visor corrects for this by comparing the ADF statistic against the tougher Engle-Granger critical values (−3.90 / −3.34 / −3.04 at the 1% / 5% / 10% levels), not the plain ones. These are also asymptotic values, so a borderline call on a short window is the least reliable region of all — and the widget says "Not cointegrated (5%)" rather than dressing a near-miss up as a pass. A conservative test that often says "no" is doing its job: false cointegration is how a pairs trade quietly bleeds out.
What it still cannot promise
Even a clean pass is a statement about the past, not a guarantee:
- The tether can break. Cointegration is a property of a sample, not a law of nature. A merger, a regime shift, or a change in what drives one leg can sever a relationship that held for years — and it tends to break precisely when the spread is at its widest, exactly where a naive trader is most tempted.
- Estimated, therefore uncertain. β itself carries error. On a short or noisy window the hedge ratio can be unstable, and a spread built on the wrong ratio only looks mean-reverting.
- Passing the test is not a trade. The widget describes a statistical relationship. Turning it into a rule with entries, exits and sizing is a separate step, and one that belongs in front of the robustness gates like any other strategy.
Correlation and cointegration are two different questions, and that is the whole reason both widgets exist. Correlation asks "do they move together?" Cointegration asks the far more demanding "does a combination of them stay put?"
What to read next
- Mean Reversion and Half-Life — how long the tether takes to pull the spread back.
- Correlation — the weaker cousin, and why moving together is not enough.