Quant Methods · intermediate · 7 min
Seasonality
"Sell in May." "The Santa rally." "September is the worst month for stocks." Markets are full of calendar folklore, and some of it has a real statistical basis while most of it is a story fitted to a handful of years. Visor's Seasonality widget exists to replace the folklore with the actual number — the average shape of a symbol's calendar year — and, just as importantly, to travel every one of those numbers with the sample size that earns it.
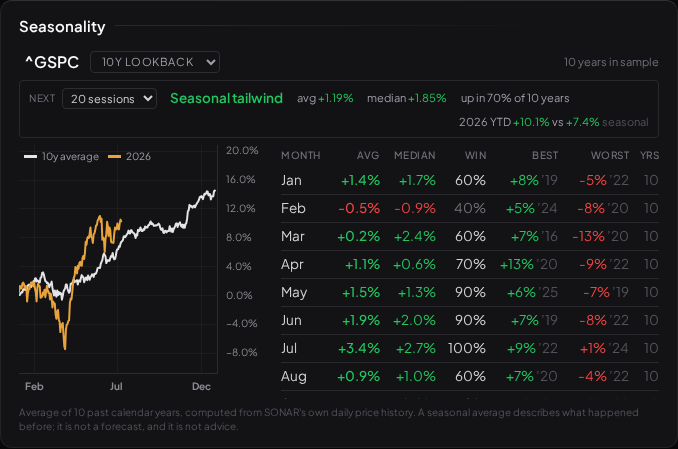
What it shows
The widget answers one question: "is this normal for the time of year?" It draws:
- An average seasonal path — the mean cumulative percentage return through the year, over a lookback you choose (5, 10, or 20 complete years) — with the current year overlaid on the same axis, so you can see whether this year is tracking, leading, or lagging the typical shape.
- A month-by-month table — for each month, the average and median return, the win rate (how often that month closed positive), the best and worst year on record, and the number of years behind each row.
- A compact tailwind / headwind verdict for the next 5, 10, or 20 trading sessions.
The same read surfaces as a small chip on Scanner rows and Daily Brief movers, always printed with its sample (7/10y) so a glance can never pick up the verdict without the count.
How it is computed — and why the details matter
The honesty is in the method, not a footnote:
- Years are aligned by trading-day ordinal, not calendar date — the nth trading session of one year against the nth of another. Aligning by calendar date forces the question "what was the price on Sunday 3 January?", which has to be forward-filled with invented flat days that drag every average toward zero, and it shifts everything after February by a day in leap years. Trading-day ordinals need no interpolation and fabricate nothing.
- The current year is never folded into the average it is compared against. Comparing this year to a benchmark that already contains this year would be circular; the widget keeps them separate.
- A flat period is not counted as a win. Nothing is nudged to flatter the record.
Statistical honesty is the whole point
Seasonality is the easiest analysis in this app to abuse, because a calendar pattern always exists in hindsight — the question is whether it means anything. The widget is built so it cannot be read as a promise:
- Every number carries its sample size. Ten years is ten observations of "January". That is a tiny sample for a confident claim, and the count is shown so you can judge for yourself.
- A positive average on a losing win rate is labelled mixed, not a tailwind. That combination means one enormous year is carrying a mostly-negative record — and calling it a tailwind is the exact dishonesty the widget exists to avoid.
- Thin samples are flagged, not dressed up. Under ten complete years — a recent listing, say — renders a prominent caveat rather than a confident-looking curve, and a symbol with no complete calendar year is told so plainly instead of being averaged from a fragment. In the Scanner, thin-sample and mixed-record symbols get no chip at all, because a caveat next to a chip does not survive being glanced at.
What it is not
A seasonal average describes what happened before. It is not a forecast, and it is not advice. "This window closed positive in 7 of the last 10 years" is a statement about ten past Januaries; it is not a claim about the next one. Ten years is a small sample, patterns that look strong can be one or two big years in disguise, and a calendar tendency has no mechanism forcing it to repeat — which is why the copy throughout the widget stays in the past tense and every expanded read ends by saying so.
If you ever wanted to turn a seasonal tendency into a rule you trade, it would face exactly the same scrutiny as any other strategy: the random control to check the timing beats luck, the out-of-sample split, and the multiple-testing correction — because "I checked twelve months and December looked best" is twelve tests, not one. Reading the calendar is free and interesting. Trading it is where the robustness gates come in.
What to read next
- The Overfitting Trap — why a pattern that fits the past need not survive the future.
- Multiple Testing — why checking every month is not one test but twelve.