Using Visor · beginner · 5 min
The Scanner
Where the feed is a running stream, the SOOS Scanner is the same activity ranked. It lists the tickers with the most signal activity over a recent window, so instead of watching events scroll past you can see, at a glance, which instruments are lighting up.
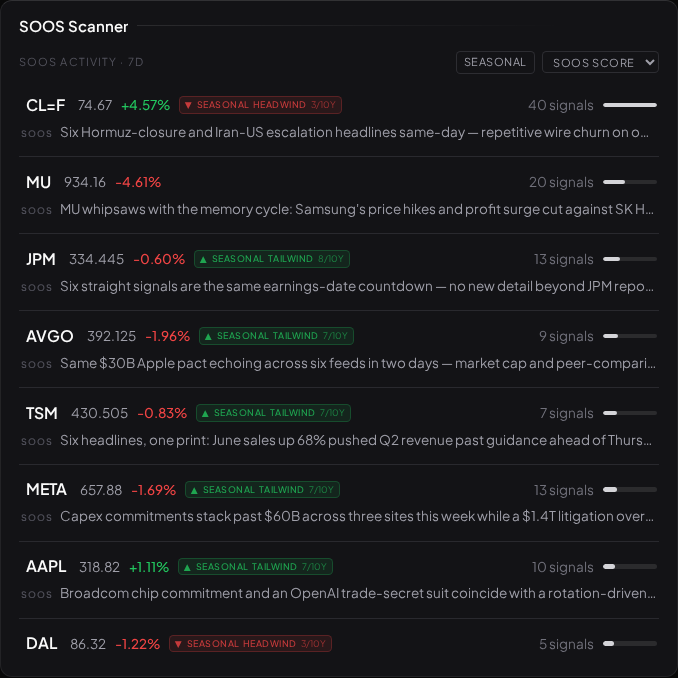
The columns
Each row is a ticker, with:
- Signal count — how many signals it has generated in the window. The headline measure of "how much is happening here."
- SOOS score — a composite activity score used to rank the rows.
- Categories — the kinds of signal firing (patterns, news, and so on), so you can tell a news-driven mover from a technically-driven one.
- Latest headline — the most recent thing that happened, with an expandable read.
- Price and change — the current quote and day move, where available.
- Seasonal — an optional per-row chip summarising how this symbol has historically behaved around this time of year (see below).
Click any row to drive your charts to that symbol, exactly like the watchlist.
Reading it honestly
The scanner ranks by activity, not opportunity. A ticker at the top of the list is one where a lot is happening — which might be worth a look, or might be noise around an earnings release. The scanner is telling you where to point your attention, not what the outcome will be. "NVDA is lighting up across three signals this week" is an observation about signal activity; it is not a claim that NVDA is a good buy.
The seasonal chip
The seasonal chip, when shown, reports something like "positive in N of the last M years around now." That is a historical calendar statistic, nothing more — it describes how the symbol behaved in past years on the same calendar path, with the sample size always shown so you can judge whether it means anything. It is not a forecast, and a small sample is flagged rather than dressed up. The Seasonality widget shows the full picture — the average calendar path, this year overlaid, and month-by-month win rates — with the same caveats.
What to read next
- Alerts — turning a watched condition into a notification.
- The Daily Brief — the digest version.