Quant Methods · intermediate · 7 min
Sharpe and Risk-Adjusted Return
The first number anyone quotes about a strategy is its return: "up 60% over five years." It is also the least informative number about it. A 60% return earned smoothly is a completely different thing from a 60% return earned by nearly blowing up twice on the way. Risk-adjusted return is the family of measures that account for the ride, and the most common of them is the Sharpe ratio.
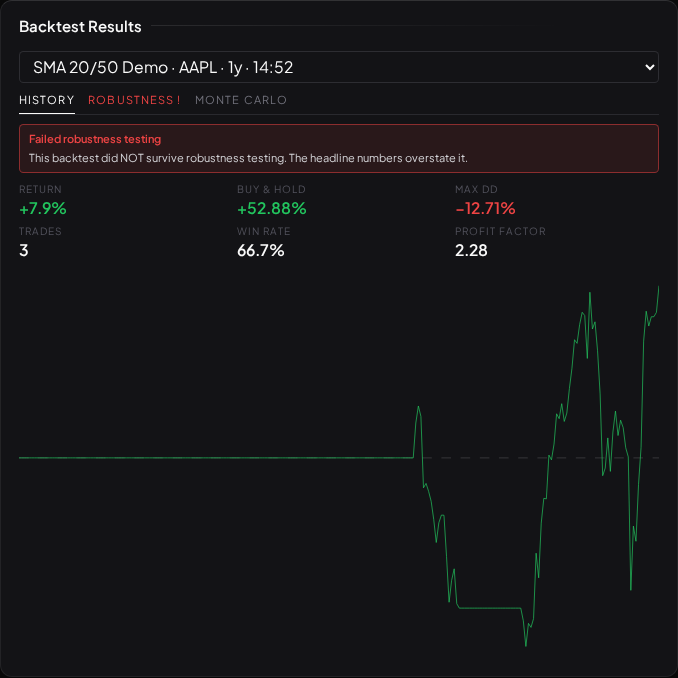
Why raw return lies
Raw return ignores two things that decide whether a strategy is actually any good:
- How much risk bought it. Any return can be manufactured by taking more risk — more leverage, bigger positions, more exposure. Doubling your size roughly doubles your return and your swings. A big number with no mention of the risk behind it is half a sentence.
- How rough the path was. Two strategies can end at the same place having travelled very differently. The one that got there in a straight line is more trustworthy — and, in the real world, more survivable, because a violent drawdown is what makes a trader abandon a plan at the worst moment (see Drawdown and Recovery).
The Sharpe ratio exists to fold both concerns into one figure.
What the Sharpe ratio is
In plain terms, the Sharpe ratio is return per unit of risk:
Sharpe = (average return − risk-free rate) / standard deviation of returns
The top is the excess return — how much the strategy beat simply parking the money at the risk-free rate. The bottom is the standard deviation of its returns, a measure of how much they bounce around: the strategy's volatility. Dividing one by the other answers "how much return did each unit of bumpiness buy?" It is usually annualised so that strategies measured at different frequencies can be compared on the same scale.
The intuition: a Sharpe of 2 means the strategy earned two units of excess return for every unit of volatility it put you through. A Sharpe of 0.3 earned very little for the same discomfort. Higher is smoother-per-unit-of-reward — up to the caveats below.
What Sharpe misses
Sharpe is a real improvement on raw return, but it is not the last word, and its blind spots matter:
- It punishes upside and downside equally. Standard deviation treats a big gain as just as much "risk" as a big loss. A strategy that occasionally leaps upward is penalised for it, which is not how any human experiences risk. (Measures like the Sortino ratio try to fix this by counting only downside moves.)
- It assumes well-behaved returns. Sharpe is most meaningful when returns are roughly bell-shaped. Many strategies are not: a rule that quietly collects small gains and rarely takes a catastrophic loss — selling tail risk — posts a flattering Sharpe precisely because the disaster has not shown up in the sample yet. The number looks great right until it doesn't.
- It is sample-dependent and searchable. A Sharpe computed on one window is an estimate with error bars. Worse, if you tried forty variants of an idea and kept the best Sharpe, that best number is inflated by the search itself — the luckiest of forty coin-flippers looks skilled. This is why Visor reports a deflated Sharpe, which discounts the figure for how many attempts were made and for skew and fat tails. Multiple Testing explains that correction in full.
How Visor uses it
Sharpe is one of the numbers on every backtest, but it never stands alone. It is one of the four robustness gates — specifically the deflated version — because a headline Sharpe, like a headline return, is exactly the kind of impressive figure that a search can manufacture. A strategy is judged on whether that Sharpe survives being discounted for the hunt that found it, not on the raw number. Return per unit of risk is a better question than return alone; "return per unit of risk, corrected for how hard we looked" is better still.
What to read next
- Multiple Testing — why the best Sharpe of many is not the Sharpe you get.
- The Random Control — the gate that asks whether the returns beat luck at all.