Risk & Psychology · intermediate · 7 min
Drawdown and Recovery
A drawdown is the drop from an account's peak to its subsequent low — how far you are, right now, below the best the account has ever been. Everyone who trades sits in a drawdown most of the time, because new highs are rare and the space between them is, by definition, a drawdown. The reason drawdowns deserve their own lesson is a piece of arithmetic that almost everyone gets wrong by instinct: the gain needed to recover a loss is always larger than the loss itself, and the gap widens fast as losses deepen.
The asymmetry, in numbers
Lose some percentage of the account, and the gain required to get back to even is not the same percentage. It is:
recovery gain = loss ÷ (1 − loss)
Work through it:
- Lose 10% → you have 90% left → you need +11.1% to get back to even.
- Lose 20% → 80% left → you need +25%.
- Lose 33% → 67% left → you need +50%.
- Lose 50% → 50% left → you need +100% — you must double what remains.
- Lose 75% → 25% left → you need +300%.
- Lose 90% → 10% left → you need +900% — a tenfold gain to undo a single bad stretch.
The reason is simple once you see it. A 50% loss halves the account, so the money left has to grow by 100% to get back to the whole. You are trying to grow a smaller base back to the original size, and the smaller the base, the harder the climb. This is why the drawdown table in Position Sizing treats a 65% drawdown as a hole rather than a dip: it needs a 186% gain to fill.
Why this changes how you think about risk
The asymmetry means losses and gains are not opposites of equal weight. A drawdown quietly raises the bar for every trade that comes after it, because those trades are now working against a diminished base. Two consequences follow:
- Avoiding deep drawdowns is worth more than chasing large gains. Staying out of the −50% zone is mathematically more valuable than the +100% it would take to escape it. Defence compounds.
- The deeper the hole, the more pressure to take bad trades to climb out — larger size, lower-quality setups, revenge trades. The maths that makes recovery hard also makes the behaviour during recovery worse. The common cognitive biases that fire hardest are the ones that fire in a drawdown.
None of this is a claim that drawdowns can be avoided — they can't. It is a claim that their depth is the thing to manage, and depth is controlled by position size, which is the lever from the earlier lessons in this track.
Seeing max drawdown in a backtest
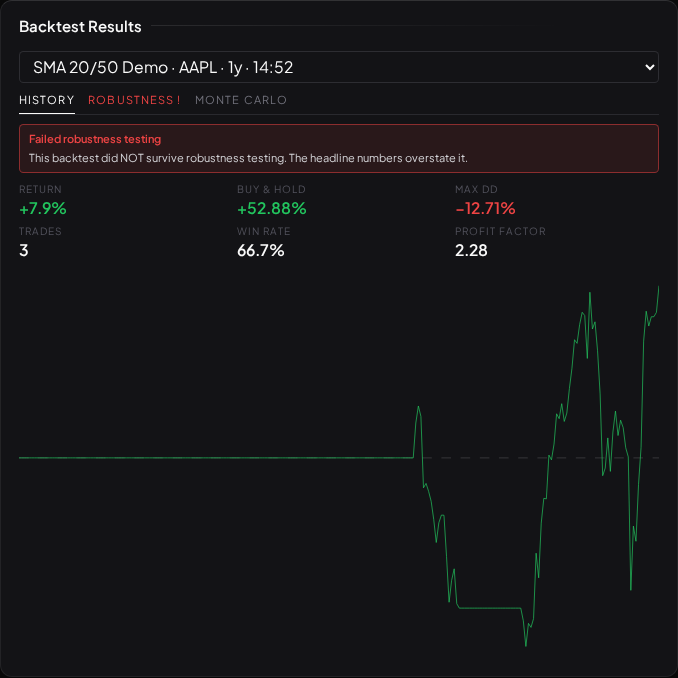
Every backtest in Visor reports maximum drawdown — the worst peak-to-trough drop over the tested history — right alongside the headline return. It is arguably the more honest of the two numbers, because it describes the worst moment you would have had to live through to collect that return. A strategy that returned +80% with a 60% max drawdown asked you to watch more than half the account evaporate on the way; most people would have abandoned it long before the recovery arrived.
The Backtest Results widget shows the equity curve and the max drawdown together for exactly this reason. Read them as a pair: the return tells you where it ended, the drawdown tells you how bad it got in between.
One caution: a backtested max drawdown is the worst drop that happened in the sample, not a ceiling on what can happen next. The future can, and eventually will, produce a worse one. The Monte Carlo lesson shows a way to get a feel for how much worse — by reshuffling the trades to see the range of drawdowns the same edge could plausibly have produced.
What to read next
- Monte Carlo — the range of drawdowns your edge could realistically produce.
- Position Sizing — the lever that sets how deep your drawdowns get.
- Common Biases — the mistakes a drawdown pushes you toward.