Risk & Psychology · intermediate · 8 min
Monte Carlo
A backtest gives you one number for return and one number for maximum drawdown. It is easy to read those as the outcome of the strategy. They are not. They are the outcome of one particular ordering of the trades — the order history happened to deal them. Shuffle that order, and the return stays roughly the same but the path changes completely: the drawdowns land in different places and reach different depths. Monte Carlo analysis is the tool for seeing that whole range instead of the single path you happened to get.
The core idea: same trades, different order
Suppose a strategy took 80 trades over its backtest. Their results — the individual wins and losses — are a fixed bag. What is not fixed is the sequence. In the real history they arrived in one specific order. But the same edge could just as easily have dealt them in a different order, and nothing about the strategy says the historical order was special.
A Monte Carlo run takes that bag of trade results and reshuffles it thousands of times, building a fresh equity curve from each shuffle. Then it looks at the spread:
- Final return barely moves — the same wins and losses, added up, reach nearly the same total regardless of order.
- Maximum drawdown moves a lot — because drawdown depends entirely on where the losses cluster. A run where five losers happen to fall back-to-back produces a deep drawdown; the same five spread out produce a shallow one.
So the single max-drawdown number your backtest reported is really one sample from a distribution. Monte Carlo draws the rest of that distribution.
What the output tells you
The useful thing to read off a Monte Carlo run is not the average — it's the tail. Typical questions it answers:
- Across thousands of reorderings, what did the worst 5% of drawdowns look like? If your backtest showed a 20% max drawdown but 1-in-20 shuffles hit 35%, then 35% is a drawdown the same edge can realistically hand you — and you should be sized to survive it, not just the 20% you happened to see.
- How wide is the spread of final returns? A narrow spread suggests the result leans on many small trades; a huge spread often means a few outsized trades carried it, and losing those would change everything.
The register to keep is honest: Monte Carlo does not predict the future. It re-samples the past to show that even your own historical trades, reordered, imply a range of experiences — and the single backtest path sat somewhere inside that range, not at its worst edge. It is a way of asking "how lucky was the ordering I got?" rather than "what happens next?"
Where it sits in Visor
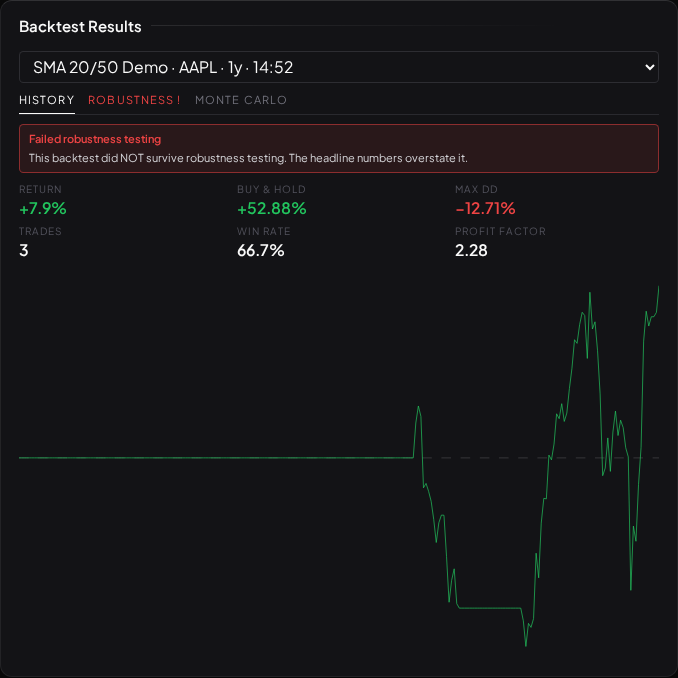
Monte Carlo analysis is part of the Backtest Results widget — run a strategy in the Strategy Editor and it appears alongside the equity curve, headline return and max drawdown. Read it next to the drawdown number from Drawdown and Recovery: the backtest tells you the drawdown that happened, Monte Carlo tells you the range of drawdowns that plausibly could have, and the recovery arithmetic tells you what each of those would cost to climb out of.
What Monte Carlo does not do
This is important, because the technique is easy to over-trust. Reordering trades tests whether your result depended on a lucky sequence. It does not test whether the edge is real in the first place. A strategy with no genuine edge — one that was curve-fitted to the past — has a bag of trades that looks profitable because it was fitted to look that way, and reshuffling a fitted bag just gives you thousands of fitted curves. Monte Carlo will happily draw a reassuring distribution around a result that will never repeat.
For the "is the edge real at all?" question you need a different test entirely: the random control and the out-of-sample split that Visor runs on every backtest, described in Reading a Robustness Report and The Overfitting Trap. Those ask whether the strategy beats a scrambled version of itself and whether it survives on data it was not fitted to. Monte Carlo assumes the edge and characterises its risk; the robustness gates interrogate the edge itself. You want both, and in that order — first prove the edge, then Monte Carlo its drawdowns.
What to read next
- Drawdown and Recovery — what the drawdowns Monte Carlo reveals actually cost.
- Reading a Robustness Report — the gates that ask whether the edge is real at all.
- The Overfitting Trap — why a fitted result reshuffles into thousands of equally fitted ones.