Strategies · intermediate · 10 min
Why Most Strategies Fail the Gate
Across this track we have taken six of the most famous, most heavily marketed strategies in retail trading, written each as a precise mechanical rule, and run it on real SPY data through Visor's robustness gates. This lesson puts all six verdicts in one place — because the pattern across them is the real lesson, worth more than any single result.
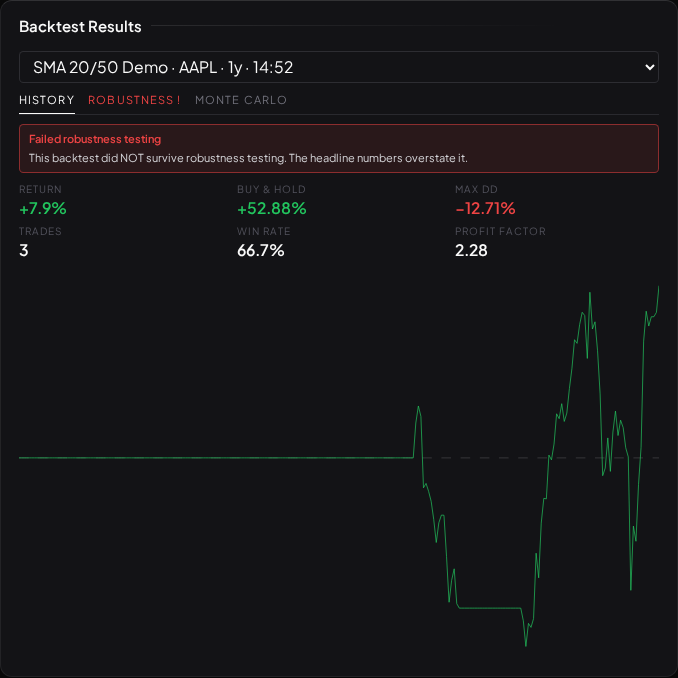
Here is the pattern, stated up front: almost all of them made money, and every single one failed. That is not a contradiction. It is the most important thing a new trader can understand, and it is the thing every course selling these strategies is structurally unable to show you.
The six verdicts
Each card below is the honest robustness report, computed once at build time by the same engine the app runs on every backtest. Read How to read a robustness report if the four gates are unfamiliar.
The golden cross — the SMA(50)/SMA(200) crossover. Made about +60% on SPY over five years:
Random control
Beat 87% of 500 randomly-timed versions of itself (real 60.37% vs random average 36.89%).
Out-of-sample
Too few trades to compare (1 in-sample, 1 out).
Significance
Too few trades to compute a t-statistic.
Deflated Sharpe
Not enough trades to estimate a Sharpe.
These checks describe how much of this backtest survives statistical scrutiny. Past simulated performance is not a guide to future results, and nothing here is a recommendation to trade.
A moving-average trend follower — the faster SMA(20)/SMA(50) version:
Random control
Beat 31.6% of 500 randomly-timed versions of itself (real 12.41% vs random average 25.67%).
Out-of-sample
Too few trades to compare (9 in-sample, 3 out).
Significance
t = 0.546 against a 3.5 threshold.
Deflated Sharpe
0.7056 — Sharpe of 0.1577.
These checks describe how much of this backtest survives statistical scrutiny. Past simulated performance is not a guide to future results, and nothing here is a recommendation to trade.
Order blocks — buying the impulse away from the last opposing candle. Made about +54%, and even survived out-of-sample:
Random control
Beat 80.2% of 500 randomly-timed versions of itself (real 53.54% vs random average 35.12%).
Out-of-sample
In-sample 28.07% · held-out 19.89%.
Significance
t = 1.671 against a 3.5 threshold.
Deflated Sharpe
0.9503 — Sharpe of 0.2438.
These checks describe how much of this backtest survives statistical scrutiny. Past simulated performance is not a guide to future results, and nothing here is a recommendation to trade.
Fair value gaps — trading the three-bar imbalance. Made about +45%:
Random control
Beat 63.8% of 500 randomly-timed versions of itself (real 44.73% vs random average 41.81%).
Out-of-sample
In-sample 24% · held-out 16.73%.
Significance
t = 1.396 against a 3.5 threshold.
Deflated Sharpe
0.9188 — Sharpe of 0.19.
These checks describe how much of this backtest survives statistical scrutiny. Past simulated performance is not a guide to future results, and nothing here is a recommendation to trade.
Liquidity sweeps — fading the false breakdown. The one that fails hardest, in two ways at once:
Random control
Beat 32% of 500 randomly-timed versions of itself (real 7.07% vs random average 18.25%).
Out-of-sample
In-sample 17.37% · held-out -8.78%.
Significance
t = 0.384 against a 3.5 threshold.
Deflated Sharpe
0.6493 — Sharpe of 0.0566.
These checks describe how much of this backtest survives statistical scrutiny. Past simulated performance is not a guide to future results, and nothing here is a recommendation to trade.
Mean reversion — buying RSI-oversold dips:
Random control
Beat 66.4% of 500 randomly-timed versions of itself (real 6.8% vs random average 3.06%).
Out-of-sample
Too few trades to compare (4 in-sample, 4 out).
Significance
t = 0.555 against a 3.5 threshold.
Deflated Sharpe
0.6976 — Sharpe of 0.1964.
These checks describe how much of this backtest survives statistical scrutiny. Past simulated performance is not a guide to future results, and nothing here is a recommendation to trade.
What the pattern is telling you
Line the six up and three failure modes account for all of them:
-
They were long a market that went up. SPY roughly doubled over the window. Almost any rule that spends time long makes money — the return is mostly participation, not skill. Four of the six made a positive return and still lost to simply buying and holding. "It made money" was never the question.
-
The timing didn't beat its own scramble. The random control re-runs each rule 500 times with its entry timing shuffled, keeping the trade count, exit, and market identical. Every one of the six was beaten by a meaningful share of its randomly-timed twins. When a coin-flip on when to enter does about as well as your signal, the signal's timing — its entire claim to skill — was not doing measurable work.
-
The ones that looked best in-sample broke out-of-sample. The liquidity-sweep rule made +17% on the first 70% of the timeline and lost on the held-out 30% — the textbook overfitting fingerprint. A rule that works on the data you can see and stops on the data you held back has fit the past, not found the future.
The honest conclusion — and the honest caveat
This is not a claim that technical analysis is worthless, that these patterns are fake, or that no one can trade. It is a narrower, harder, more useful claim: the simple, mechanical, first-taught version of every famous strategy, on this instrument and window, was indistinguishable from luck once tested properly — and the reason nobody selling these strategies tells you that is that the test is easy to hide. Show the in-sample line going up; don't show the held-out half or the scrambled twins.
Two honest caveats keep this fair. First, these are specific mechanical versions on one instrument over one five-year window — a discretionary trader reading the same pattern in context is doing something these rules don't capture, and a different instrument or period could look different. Second, and more important: none of this tells you what will happen. It tells you what these rules did, and how to check whether a result is signal or luck. That check — the random control and the out-of-sample split — is the single most valuable habit in trading, and it is the one thing Visor insists on that a £997 course never will.
What to read next
- The Random Control — the scrambled-twin test every one of these failed.
- The Overfitting Trap — the in-sample/out-of-sample failure, in depth.
- Building Your Own — put your own idea through the same gates.