Market Basics · beginner · 6 min
The Bid, the Ask, and the Spread
Newcomers picture a market as having a price — one number. In reality there are always two, side by side, at every moment. Once you see them, a lot of small mysteries ("why did I lose a little the instant I entered?") resolve themselves.
Two prices
- The bid is the highest price a buyer is currently willing to pay.
- The ask (or offer) is the lowest price a seller is currently willing to accept.
The ask is always a little higher than the bid — sellers want more than buyers want to give, or there'd be no gap to trade across. The single "price" you usually see quoted is a convenience: often the midpoint, or the price of the last trade that actually happened. The two live prices are what you actually transact against.
The spread
The gap between the bid and the ask is the spread.
If the bid is 100.00 and the ask is 100.04, the spread is 0.04. That gap matters because of a simple asymmetry: to buy right now you pay the ask, and to sell right now you receive the bid. So the moment you buy at the ask, the price at which you could immediately sell again is the bid — a touch lower. You start marginally underwater, by the width of the spread, before the market has moved at all.
That is the spread as a cost. It's not a fee anyone charges you explicitly; it's the price of demanding immediacy — of wanting to trade now rather than waiting. Cross the spread twice (once in, once out) and you've paid it twice.
What makes a spread wide or narrow
Spreads are not fixed. They breathe with the market:
- Liquid, heavily-traded instruments in active hours tend to have tight spreads — many buyers and sellers stacked close together (see Volume and Liquidity).
- Thin instruments, or quiet hours, or moments of stress, tend to have wider spreads — fewer participants, and they demand more of a gap.
So the same instrument can cost you almost nothing to cross at midday and noticeably more in the middle of the night or during a violent move. This is one honest reason the exact timing and instrument you trade changes your costs — described here as a fact about market mechanics, not as advice about when to act.
Seeing it on the ladder
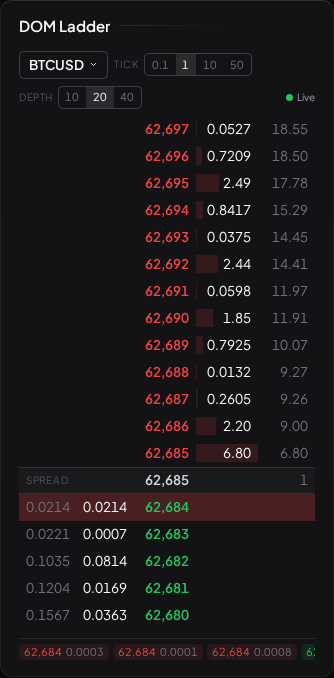
The two prices — and the orders stacked behind them — are exactly what the depth-of-market ladder shows. Visor's DOM widget (orderflow_dom) displays a price ladder with resting buy orders on the bid side and sell orders on the ask side, so you can see the best bid, the best ask, and the gap between them directly, plus how much size is queued at each level.
An important honesty note: rich order-book (Level 2) data is not licensed for every instrument, and resting orders on a ladder can be pulled before they ever fill — the ladder shows intent, which isn't a promise. The tape-reading track treats that scepticism as a core skill; see The DOM Ladder for how to read it and Spoofing and Fakes for how it misleads.
What to read next
- Volume and Liquidity — why some spreads are tight and others wide.
- Market vs Limit Orders — the choice to cross the spread now or wait at your own price.
- The DOM Ladder — reading the bid and ask stack directly.