Market Basics · beginner · 7 min
Asset Classes
The candles look the same, but what sits behind them differs a lot. An asset class is a family of instruments that share how they trade, when they trade, and what drives them. Visor covers several — equities, FX, crypto, commodities, plus indices and rates — and a chart reader benefits from knowing how each behaves.
Equities (stocks)
A share is part-ownership of a company. Its price reflects what the market thinks that company is worth, so equities respond to earnings, guidance, sector trends, and company-specific news on top of the whole market's mood.
For a chart reader, the practical features: equities trade on exchanges with fixed hours (so charts have overnight gaps — the price can open away from where it closed), and they can move sharply around scheduled events like earnings dates. Individual stocks vary enormously in liquidity — a mega-cap trades tightly, a small-cap can be thin and jumpy.
FX (foreign exchange)
FX is the market for one currency against another, always quoted as a pair (EUR/USD, GBP/JPY). A single price is really a ratio — how much of one currency buys the other — so "the euro rose" and "the dollar fell" can be the same chart.
Features for a reader: FX is enormous and highly liquid in the major pairs, giving tight spreads, and it trades ~24 hours on weekdays across global sessions, so charts flow continuously with fewer gaps than equities. It's driven heavily by interest rates, central-bank policy, and macro data rather than company news.
Commodities
Commodities are physical goods — oil, gold, natural gas, wheat — usually traded as futures (contracts for delivery at a set date). Prices are driven by real-world supply and demand: weather, harvests, production decisions, geopolitics, storage.
For a reader: commodity charts can show strong seasonal tendencies (heating demand, harvest cycles) and react hard to supply shocks. Because they trade as futures with expiry dates, there are contract-roll quirks a reader eventually meets, though the candles read the same way.
Crypto — read-only in Visor
Crypto assets (like Bitcoin) trade on their own venues, 24/7, all year, with no market close — so charts never gap for the weekend, and moves can happen at any hour. Historically it has been among the more volatile classes, with liquidity that varies sharply by venue and time.
One thing must be explicit: in Visor, crypto is data to read and analyse, nothing more. The app shows crypto charts, quotes, and — uniquely — a live BTC options chain for analysis. It never frames crypto as something to acquire, hold, or trade, and neither does this lesson. Describing how a crypto chart behaves is market literacy; it is not an invitation to buy.
Why the differences matter to a chart reader
Same candlestick grammar, different terrain underneath:
- Trading hours decide whether your chart gaps (equities, commodities) or flows continuously (FX, crypto).
- What drives it decides which news matters — company earnings for a stock, a central-bank meeting for FX, a supply shock for oil.
- Liquidity and volatility differ by class and by instrument, which changes spreads, slippage, and how violently price moves.
A pattern or level that reads cleanly on a liquid major FX pair may behave very differently on a thin small-cap or an overnight crypto move. This is one more reason a chart shape that "worked" in one place is no guarantee elsewhere — the honesty theme running through the whole library, and exactly what Visor's robustness gates test (see The Overfitting Trap).
Seeing them in Visor
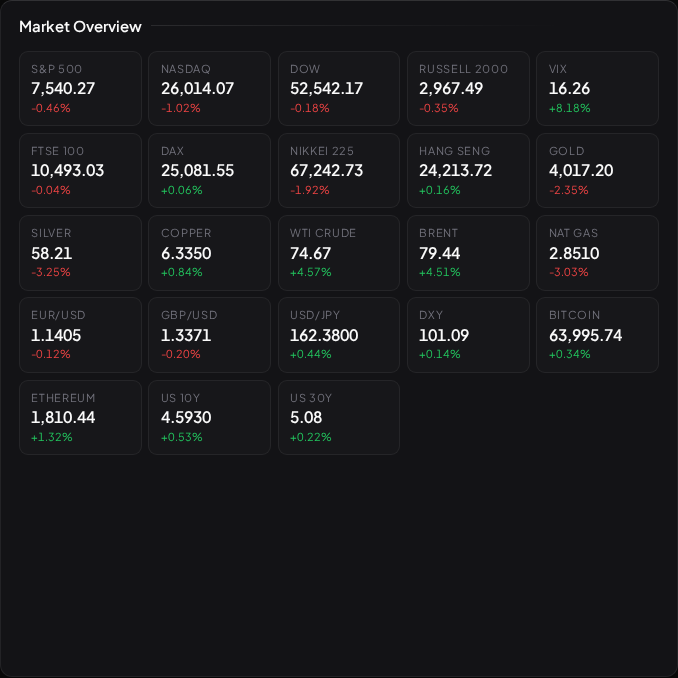
The Market Overview widget shows many instruments across classes at a glance — indices, commodities, FX, crypto, rates — and clicking any one opens a detail view with a mini chart and its latest news. The Watchlist and symbol pickers let you assemble your own mix from the same universe. Both are ways to observe the market across classes; neither ranks anything as an opportunity.
What to read next
- Volume and Liquidity — the variable that differs most across classes.
- What Moves Markets — the different drivers behind each class.
- Following Symbols — building a watchlist across asset classes in Visor.