Options · intermediate · 8 min
Implied Volatility
Volatility is the one input to an option's price that nobody can look up. Spot, strike, expiry, rates — all observable. But how much the underlying will move between now and expiry is unknowable in advance, and it is the single biggest driver of what an option is worth. Implied volatility (IV) is how the market puts a number on that unknown.
Realised vs implied
Two different things wear the word "volatility", and keeping them apart is the whole lesson.
- Realised (or historical) volatility is backward-looking: how much the underlying actually moved over some past window. You compute it from the price history. It is a fact about what already happened.
- Implied volatility is forward-looking: the volatility figure the market is currently baking into option prices. It is not computed from price history — it is backed out of option premiums.
The mechanism is the inversion from Black-Scholes. Take an option's actual market premium as given, and solve the model backwards for the volatility that reproduces that exact price. That solved figure is the implied volatility. The Options Calculator's implied-vol mode does precisely this: enter the market premium and it inverts the model to recover the vol, then re-derives every greek at that solved value.
So IV is really a restatement of the option's price in the language of volatility. Saying "this option trades at 60% IV" and "this option is expensive" are, roughly, the same statement — 60% IV is high, meaning the market is paying up for expected movement.
Why the gap between them matters
IV and realised vol rarely match, and the gap is informative:
- When IV sits well above recent realised vol, the market is pricing in more movement than has lately occurred — often ahead of a known event (earnings, a rate decision, a protocol upgrade). Options are "expensive" in the sense that you are paying for movement that hasn't shown up yet.
- When IV sits below realised vol, the market is pricing in less movement than has been happening — options look "cheap", but usually because the recent turbulence is expected to fade.
This is descriptive, not a signal. "IV is elevated into earnings" is an observation about how options are priced; it is not a claim that the option is a good buy or sell. Many people learn the hard way that buying an option because "a big move is coming" fails when the move arrives but IV was already pricing it — the event resolves, IV collapses (vol crush), and the vega loss from The Greeks eats the directional gain. Being right about the move is not enough if you overpaid for the volatility.
The volatility smile
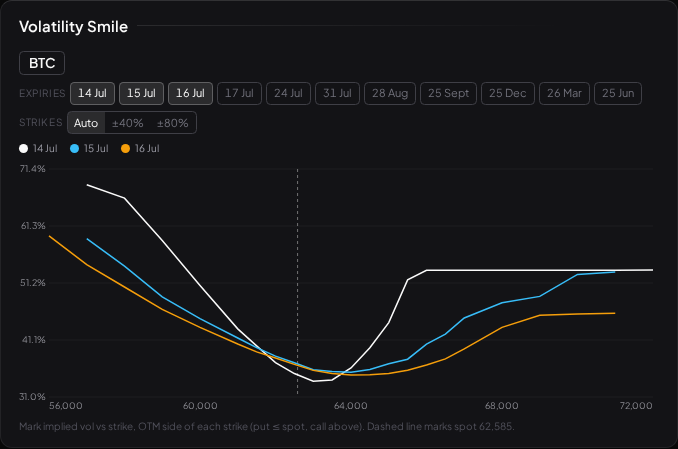
Black-Scholes assumes one volatility for all strikes. The market flatly disagrees. If you back out the IV of every strike at a single expiry and plot IV against strike, you do not get a flat line — you get a curve, usually a smile or a lopsided skew, with out-of-the-money strikes (especially downside puts, in equities) carrying higher implied vol than at-the-money ones.
That shape is the market's admission that returns have fat tails — big moves, and crashes in particular, happen more often than the tidy Black-Scholes world allows. Traders pay up for the wings because the wings are where the model most under-prices risk. The smile is, in effect, the market patching the model's "constant volatility" assumption strike by strike.
Reading the Vol Smile widget
Visor's Volatility Smile widget draws exactly this: mark implied vol against strike, one line per expiry, off the live BTC options chain (Deribit). A few honest notes on reading it:
- It plots one line per expiry, with a multi-expiry picker that defaults to the nearest three, and a spot marker so you can see where the money is.
- Each strike shows the out-of-the-money wing — puts at or below spot, calls above — because that is the more reliably-marked side, so each expiry reads as one clean curve instead of two noisy overlapping ones.
- It is BTC only today, because that is the first live chain Visor has. Equity chains need a licensed data vendor that isn't wired up yet. For equities, the Options Calculator's vol input is yours to supply.
The shape of the curve — how steep the skew, how the near expiry compares to the far — is a picture of how the market is pricing risk across strikes and time. It describes the current pricing landscape. It does not tell you what the underlying will do, and a steep skew is not an instruction.
Building intuition
In the Options Calculator, hold everything fixed and raise the volatility input: the premium climbs, with no move in the underlying at all. That is vega, and it is why IV is the input traders argue about most. Then switch to implied-vol mode, type in a premium a little above the theoretical price, and watch the solved IV rise to meet it — you are reading the market's volatility opinion straight out of a price.
What to read next
- The Greeks — vega, the sensitivity that makes IV matter.
- Black-Scholes — the model IV is inverted out of, and its limits.
- Options Risk — including how vol crush turns a right call into a loss.