Options · intermediate · 8 min
The Greeks
An option's premium is not a fixed thing. It moves as the underlying moves, as time passes, as volatility shifts, as rates change. The greeks are a set of numbers that each measure one of those sensitivities — how much the price changes when you nudge one input and hold the rest still. They are the vocabulary options traders use to describe an option's behaviour, and the Options Calculator widget returns the full set, each labelled with its units.
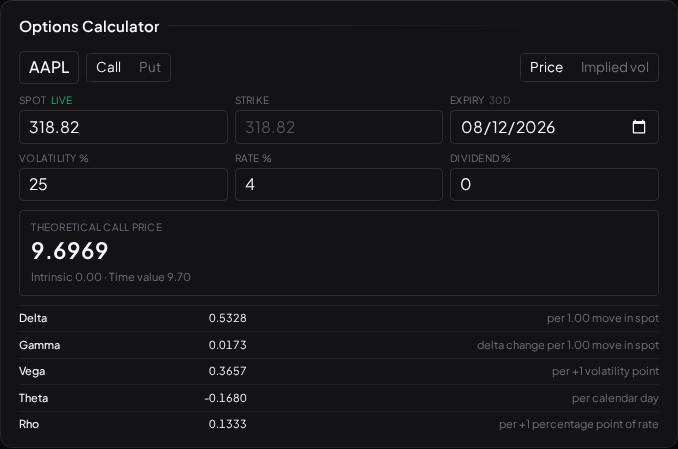
Two cautions before the definitions. First, every greek is a model output, not an observed fact — it comes out of the Black-Scholes-Merton maths (Black-Scholes) and inherits that model's assumptions. Second, greeks are local: they describe the sensitivity right here, right now, and they themselves change as the world changes. That second point is what gamma is about.
Delta — sensitivity to price
Delta is how much the option's price moves for a 1-unit move in the underlying. A call delta of 0.60 means the call gains roughly 0.60 when the underlying rises by 1. Calls have delta between 0 and 1; puts between −1 and 0 (they gain when the underlying falls).
Delta doubles as a rough probability-of-finishing-in-the-money read and as a hedge ratio — 0.60 delta behaves like holding 0.60 of the underlying. Deep in-the-money options have deltas near ±1 (they track the underlying almost one-for-one); deep out-of-the-money options have deltas near 0 (barely responsive).
Gamma — how delta itself moves
Gamma is the sensitivity of delta to the underlying — the rate of change of the rate of change. High gamma means delta shifts quickly as price moves, so your directional exposure changes fast underneath you.
Gamma is largest for at-the-money options near expiry, and it is the reason short-dated options feel so twitchy: a small move in the underlying can swing an option from barely-responsive to fully-responsive in a session. Gamma is also the pivot of the dealer-positioning story in Options Risk — the GEX Profile widget is a map of where gamma concentrates across the chain.
Theta — the cost of time
Theta is how much value the option loses per day, all else equal — the decay of time value from Intrinsic and Time Value, now as a number. For an option buyer, theta is usually negative: you bleed a little each day the underlying sits still. For a seller, theta works the other way — it is the rent they collect. Theta accelerates as expiry approaches, which is why the final weeks of an option's life are so punishing to holders who are waiting on a move.
Vega — sensitivity to volatility
Vega is how much the price moves for a 1-point change in implied volatility. Rising volatility inflates the "maybe" and lifts every option's price; falling volatility deflates it. This is why an option can lose money after good news: the event resolves, implied volatility collapses ("vol crush"), and the vega loss swamps the delta gain. Vega is largest for longer-dated, at-the-money options. The Implied Volatility lesson is entirely about the input vega reacts to.
Rho — sensitivity to interest rates
Rho is how much the price moves for a 1-point change in the risk-free rate. For most retail-horizon, short-dated options it is the smallest greek and rarely the thing that matters — but it is there in the calculator for completeness, and it grows with time to expiry.
Charm and vanna — the second-order pair
The calculator also returns two second-order greeks that the Visor analytics widgets lean on:
- Charm — how delta drifts as time passes (delta decay per day). It tells you how your directional exposure changes just from the clock ticking.
- Vanna — how delta changes as volatility changes.
These matter less for a single position and more in aggregate: the Greek Exposure Surface widget draws a strike-by-expiry heatmap of open-interest-weighted charm or vanna across the live chain, giving a picture of where those second-order exposures pile up. Read it as what exposure is sitting in open interest, deliberately presented unsigned — it imposes no assumption about who is long or short. That distinction is the whole difference between the surface and the GEX view discussed in Options Risk.
Seeing them move
The honest way to build intuition is to poke the model. In the Options Calculator, change one input at a time and watch which greeks move and by how much:
- Nudge spot up: delta rises (that is gamma), the price moves by roughly delta.
- Bring expiry closer: theta shows up as a falling price and gamma sharpens.
- Raise volatility: vega lifts the price with no move in the underlying at all.
Greeks are a description, never an instruction. "This position is long 40 delta and short theta" is a precise statement about how it will react — not a claim about what the underlying will do. Keeping that line clean is what separates using the greeks from being used by them.
What to read next
- Black-Scholes — the model the greeks fall out of, and where it breaks.
- Implied Volatility — the input vega is most sensitive to.
- Options Risk — how these sensitivities compound into fast losses.