Reading the Tape · intermediate · 7 min
Time and Sales
The DOM ladder shows resting orders — intentions waiting to be filled. Time and sales shows the opposite side of the transaction: the trades that actually happened. It is the literal "tape" that gave tape-reading its name, back when prices really did clatter out of a ticker on a paper ribbon.
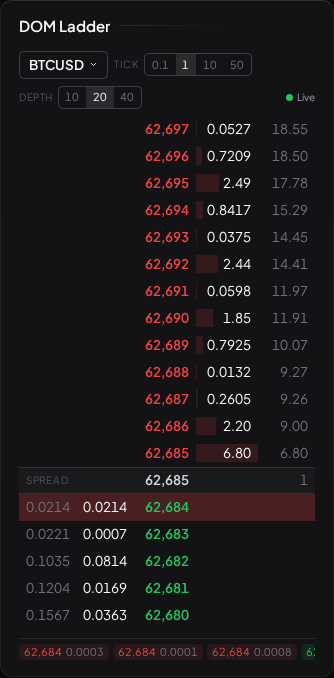
What a print is
Every time an aggressive order crosses the spread and matches with resting size, a trade prints. Time and sales is the running list of those prints, newest at the top. Each line carries three facts:
- Price — the level the trade executed at.
- Size — how much traded.
- Time — when, down to the millisecond in a fast market.
Where the DOM is a snapshot of what could trade, the tape is the record of what did. Nothing on the tape can be cancelled — a print is a completed fact. That makes it, in one specific sense, more trustworthy than the book: resting orders lie, but executed trades don't.
Aggressor side: who crossed the spread
The single most useful thing the tape adds is aggressor side — which party was the impatient one. Every trade has a passive side (the resting limit order that was sitting there) and an aggressive side (the market order that reached out and took it):
- A print that executes at the offer means a buyer crossed up to take the resting sell. The buyer was the aggressor. This is often shown as a "buy" print.
- A print that executes at the bid means a seller crossed down to hit the resting bid. The seller was the aggressor — a "sell" print.
Reading a stream of prints and noting which side keeps aggressing is how tape-readers gauge pressure. A run of large prints lifting the offer, again and again, is aggressive buying. A cascade hitting the bid is aggressive selling. This is the raw material behind cumulative delta — the running tally of aggressive-buy size minus aggressive-sell size — though the simplest version is just watching which colour dominates the tape.
Note the honest limit: for every buyer there is a seller, always. Aggressor side does not mean "more buyers than sellers" — that's impossible. It means one side was more impatient, willing to pay the spread to get filled now. That impatience is the information. It is not a headcount.
Speed and size
Two qualities of the tape carry as much meaning as the prices themselves:
- Speed — how fast prints arrive. A tape that suddenly accelerates, trades stacking up faster than you can read them, marks a burst of activity: a level breaking, news hitting, stops triggering. A slow, sporadic tape is a quiet market where each print means little.
- Size — the difference between a hundred small prints and one large one. A single large print crossing the spread is one participant with conviction (or one large order sweeping several levels); a flurry of tiny prints is retail-scale churn. Size tells you who is trading, not just that trading happened.
The combination is what you read. Big prints arriving fast, all on one side, is a very different tape from small prints trickling in — even if the price ended up in the same place.
The tape and the book together
The tape and the DOM are two halves of one picture, and they're most useful read together. The book shows the resting size at a level; the tape shows that size being consumed. When you watch a large offer on the DOM and then see print after print eating into it on the tape, you're watching aggression meet resting supply in real time. If the offer keeps refilling as fast as the tape eats it, that's absorption — one of the most-watched patterns in the whole discipline.
What Visor reads
Visor's order-flow widgets read a live Level 2 feed, which in the current build is crypto order-book and trade data — the venue where continuous free depth-and-trade data is available to read. Executed trades also surface as trade bubbles on the liquidity heatmap, sized by the trade and placed at their price, so you can see prints in the context of the resting book they hit. As everywhere in this track, this is about reading trade data as market information — the crypto feed is a data source for studying flow, not a prompt to trade the asset.
Keeping it honest
The tape is hypnotic, and that's a hazard. Watching prints scroll, it's easy to feel you're seeing the future — you are not. You are seeing a very detailed record of the immediate past. The tape is genuinely more honest than the book, because prints can't be faked the way resting orders can. But "more honest about what happened" is not "predictive of what's next." A fast, one-sided tape describes pressure that existed a second ago; it can reverse in the next. Read it as a lens on the level in front of you, and keep The Tape in Context close.
What to read next
- Absorption and Exhaustion — when aggressive prints hit resting size and fail to move it.
- The DOM Ladder — the resting book the tape trades against.
- Volume and Liquidity — how printed size aggregates into the volume you see on a chart.