Using Visor · advanced · 8 min
Net Premium Flow
The GEX Profile and Greek Surface read the options chain's open interest — contracts outstanding, a stock. Net Premium Flow reads the opposite thing: the options tape, a flow. It answers a single question — over a recent window, how much premium did aggressive takers spend buying options versus selling them? — and it does so honestly about how much of the tape it has actually seen.
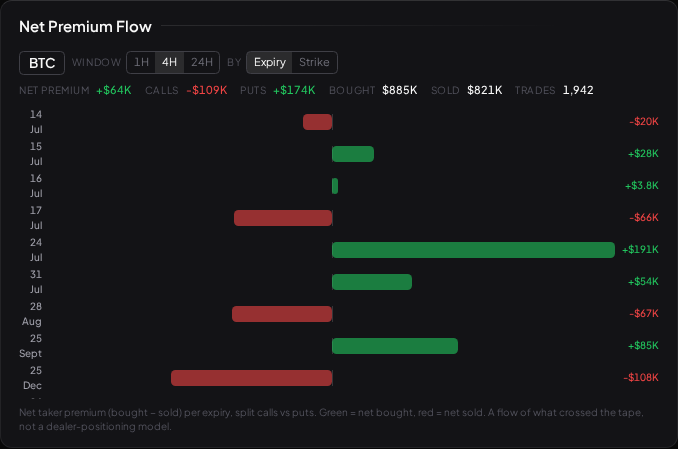
It reads the live BTC options tape (Deribit), the one live options chain Visor carries today. Equity options flow needs a licensed vendor that isn't wired up yet.
What "net premium" measures
Every options trade that crosses the tape has an aggressor — the taker who lifted the offer or hit the bid — and a premium in dollars. The widget tags each print by which side the taker was on and sums the premium:
- Bought — total premium takers paid to buy options (lifting offers).
- Sold — total premium takers received to sell options (hitting bids).
- Net premium — bought minus sold. Positive (green) means takers were net buyers of premium over the window; negative (red) means net sellers.
The summary row across the top carries all of these, plus the call/put split — net premium for calls and for puts separately — and the raw trade count, which tells you how much tape is behind the numbers. A large net figure on a handful of trades is barely evidence; the count is there so you never forget to check it.
Reading the flow list
Below the summary, the flow is broken into a diverging bar per bucket: net-bought grows right and green, net-sold grows left and red, with bar widths normalised to the largest net in view. Two controls shape it:
- Window — the rolling lookback: 1H, 4H (the default), or 24H.
- By — whether to bucket the flow by expiry (chronological rows — which dated contracts the premium went into) or by strike (ascending rows — which price levels the flow clustered around). Buckets with no trades are dropped so the list stays dense.
Each row's value carries the call-versus-put split on hover, so a strongly net-bought expiry that is all puts reads very differently from one that is all calls.
The "collecting since" caption — honesty as a feature
The most important thing about this widget is the caption that sometimes sits under it: "Collecting since 14:20 — window still filling as data accumulates."
Here is why it exists. The widget can only count trades it has actually observed — the tape it has accumulated since ingestion began watching. When you first add a 24H view, Visor has not been recording the tape for a full 24 hours yet, so the "24H" number is really over a partial window that has only been filling since it started. Rather than dress a two-hour sample up as a full day, the widget says exactly when its coverage began and that the window is still filling. Once the accumulated tape genuinely spans the whole window, the caption disappears.
This is the same discipline as the robustness report: the honest presentation of a limit is worth more than a confident number that quietly overstates its evidence. Read the caption before you read the flow — a net figure over a still-filling window is a smaller sample than the window label suggests.
What it is, and what it is not
The widget's own footer states the boundary plainly: this is a flow of what crossed the tape, not a dealer-positioning model. It tells you what takers did — the premium they spent and on which side — over a window Visor watched. It does not tell you who is net long or short, what dealers are hedging, or what happens next.
The temptation with any flow number is to read intent into it: "big call buying, price must go up." That is a story layered on a sample. Net premium flow is descriptive — a record of aggression on the options tape — and it is most useful as context alongside the chain's structure (GEX Profile, The Volatility Smile), never as a signal that fires on its own.
What to read next
- The Volatility Smile — how the same chain prices risk across strikes.
- The GEX Profile — the chain's gamma structure, and its assumptions.
- Implied Volatility — what the premium these takers paid is really pricing.