Using Visor · advanced · 9 min
The GEX Profile
Gamma exposure — GEX — is one of the most talked-about and most misused ideas in options. The Options Risk lesson makes the case for scepticism; this lesson is the reading guide for the widget itself: what every bar, line and number on it means, and how to hold all of it at the right arm's length.
It reads the live BTC options chain (Deribit), the one live chain Visor carries today.
The assumption comes first, on purpose
Before any reading, the single load-bearing fact: GEX is a modelled estimate that rests on an assumption about who holds what. The widget uses the standard retail convention — dealers are assumed long calls and short puts — and it says so in plain text on every view: an assumed book, not a measured one. Nobody outside the dealers actually knows their positioning. If the assumption is wrong, the sign of the entire picture flips. Read everything below through that caveat, because the widget wants you to.
The chart — bars, line, and flip
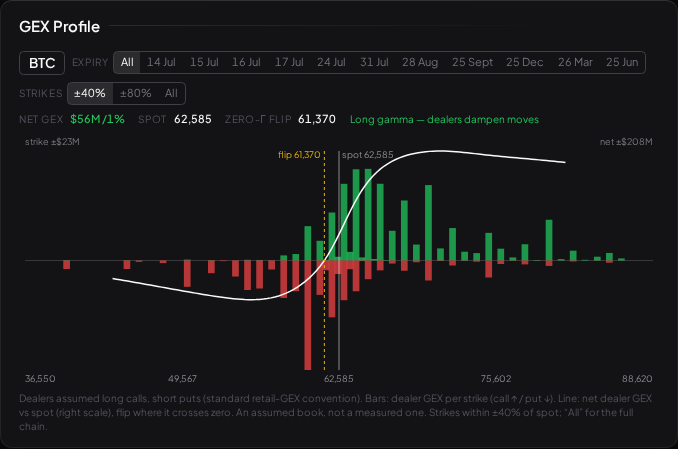
The GEX Profile puts price on the horizontal axis and carries two things at once:
- Per-strike bars — dealer gamma concentrated at each strike, call gamma drawn up in green, put gamma down in red. This is where gamma piles up across the chain.
- The net-GEX-vs-spot line — the aggregate net dealer gamma as spot moves, on its own right-hand scale (it is typically far larger in magnitude than any single strike's bar, so it needs a separate scale or it would flatten the bars).
- Vertical markers — a solid line for spot, and a dashed line for the zero-gamma flip: the spot level at which net dealer gamma is modelled to cross zero. The flip is re-derived on a grid of spot values, recomputing each option's gamma at the shifted spot with the same Black-Scholes maths as the Options Calculator. When net GEX stays one sign across the whole ±30% band, there is no flip and the widget says so.
The readout strip above the chart gives you the headline numbers: Net GEX (per a 1% move), Spot, and the Zero-γ flip level.
Long gamma versus short gamma — the mechanics
The net total drives a regime label, and this is the piece of GEX with a defensible mechanical story:
- Positive net GEX — "long gamma": under the assumed book, dealers are net long gamma. Hedging a long-gamma position means selling into rallies and buying into dips — mechanically dampening realized volatility, all else equal.
- Negative net GEX — "short gamma": dealers are net short gamma, so hedging runs the other way — buying into rallies and selling into dips — mechanically amplifying moves.
That is a statement about hedging mechanics under an assumption, not a forecast. "Dealers long gamma here" is commonly held to imply a calmer tape; it is not a promise of one, and the assumption underneath can be wrong.
The strike-window control
The BTC chain spans roughly $30k to $325k in strikes against a ~$63k spot — more than a 10× range — so drawing every strike on a linear axis crushes all the near-money action into the left third. The Strikes control fixes this:
- ±40% (the default) and ±80% clip the strike axis to a band around spot, so near-money bars fill the chart.
- All shows every strike, switching to a log axis when the span is wide so both the near-money cluster and the far-LEAP wall stay legible.
The caveats, which are the point
GEX is where a chain of assumptions gets mistaken for a crystal ball. From Options Risk, the load-bearing cautions:
- Modelled, not measured. The positioning assumption is the shaky foundation, and the gamma values come out of Black-Scholes and inherit every limit from the Black-Scholes lesson — constant vol, no gaps, a tidy world that crashes are not tidy in.
- Built on open interest, which is contracts outstanding — not who is long or short, not fresh flow, not intent.
- Widely misused as a forecast. "Price will pin to the flip", "we'll magnet to max gamma" — these are stories on top of assumptions, each of which can be wrong. GEX describes a modelled structure in the current open interest; it is not a prediction and never a signal to trade.
The honest way to read it: a map of where a set of assumptions says dealer hedging pressure might sit — interesting context, defensible only as far as its assumptions hold. For the version that drops the positioning assumption entirely, see The Greek Surface, which reports charm and vanna unsigned precisely because the "who holds what" step is the fragile one.
What to read next
- Options Risk — GEX as an analytical lens, not a signal, at length.
- The Greek Surface — the same chain read without a dealer assumption.
- Black-Scholes — the model the gamma numbers fall out of, and its limits.