Reading the Tape · intermediate · 7 min
What Is Order Flow
Most of this app looks at price as a finished thing. A candlestick records what already happened over a period — open, high, low, close. Order flow looks one layer underneath that: at the orders themselves, before and as they turn into price. It is the difference between watching the scoreboard and watching the game.
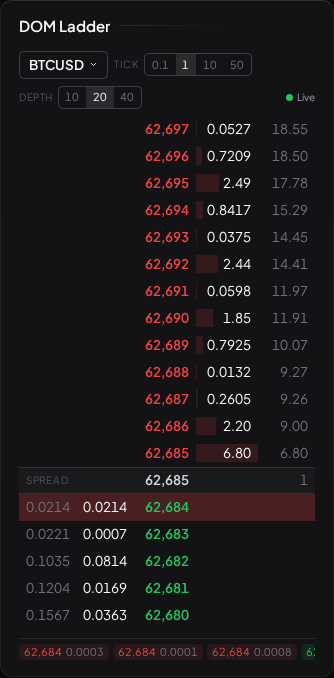
Price is the outcome; orders are the cause
A price only moves because someone was willing to trade at the next level. Under every candle is a continuous negotiation between two kinds of order:
- Resting orders — limit orders sitting in the book, offering to buy below or sell above the current price. They are patient. They set the prices at which trades can happen. (If limit versus market orders are unfamiliar, read Market vs Limit Orders first.)
- Aggressive orders — market orders that cross the spread and take whatever resting size is available right now. They are impatient. They are what actually causes the last traded price to change.
Order flow is the study of that interaction: how much size is resting where, and which side is doing the aggressing. A green candle is the record that buyers won a period. Order flow is watching how they won it — whether they had to chew through heavy resting sell orders, or whether the sellers simply stepped away.
Watching intent, not just result
The reason traders look here is that the same candle can be built two completely different ways. A bar that closes up ten points might be a wall of aggressive buying absorbing everything in its path, or it might be thin liquidity that let a modest order drift the price up with little conviction behind it. On the chart those look identical. In the order flow they look nothing alike.
That is the honest appeal of the tape: it shows intent forming, not just the outcome after the fact. But hold that word intent lightly. An order resting in the book is a stated willingness to trade — nothing more. It can be cancelled a millisecond later, and often is (you'll meet that problem squarely in Spoofing and Fakes). Order flow shows you what participants are offering to do, which is genuinely more information than price alone — but it is not a window into what they will actually do next.
What Visor shows
Visor reads live order flow through two connected views:
- The DOM ladder (
orderflow_dom) — a depth-of-market ladder listing the resting bid and ask size stacked at each price level. This is the raw book, read top to bottom. It gets its own lesson: The DOM Ladder. - The liquidity heatmap (
ofm, the OrderFlowMap widget) — the same resting book, but painted as colour over time so you can see where liquidity has been building or thinning, with executed trades marked as bubbles on top. That's covered in Liquidity Heatmaps.
These read a live Level 2 (L2) feed. In the current build that live depth is crypto order-book data — the venue where continuous, free L2 is available to read. Everything in this track is about reading that data as market information. Nothing here is about acquiring the asset; a crypto book is a data source for studying flow, and this track treats it as exactly that and nothing more.
Why it is a lens, not a signal
It is worth planting the flag early, because the rest of this track keeps returning to it. Order flow is high-resolution, and high resolution is seductive — every flicker looks meaningful. It is not. The book updates thousands of times a minute; most of that is noise, cancellation, and repositioning. Reading it well is mostly learning what to ignore.
Order flow tells you about pressure and liquidity right now. It does not tell you where price will be in an hour, and it cannot be backtested into a mechanical edge the way a rule on candles can — there is no clean out-of-sample test for "the tape looked heavy." Treat it as a lens that sharpens your read of a level you already care about, not a signal that fires on its own. The final lesson, The Tape in Context, makes that case in full.
What to read next
- The DOM Ladder — how to read the depth-of-market book, level by level.
- Market vs Limit Orders — the two order types the whole tape is built from.
- Time and Sales — the record of trades actually printing.