Using Visor · intermediate · 9 min
Reading Order Flow in Visor
The Reading the Tape track covers what order flow is — watching the orders that move price, not just the price they leave behind. This lesson is the product companion: which Visor widgets show order flow, what each one is best at, and how they differ. The concepts live in that track; here we map them onto the panels you actually add to a workspace.
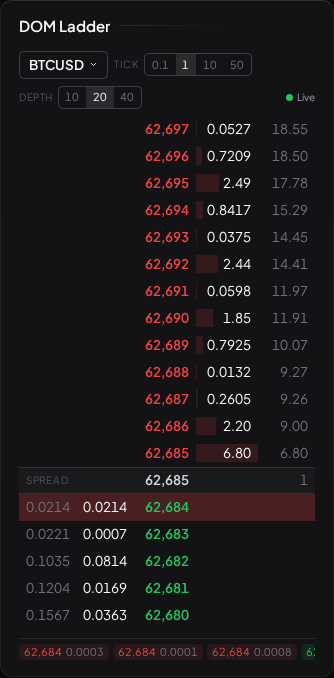
Visor gives you four order-flow surfaces, and they answer different questions. All three read the same live Level 2 crypto feed (BTC and ETH order-book depth on Binance), because that is the venue where continuous free depth is available to read. As with the whole tape track, this is about reading the book as market information — never a suggestion to acquire the asset.
Surface 1 — the DOM Ladder: the book now
The DOM Ladder widget (orderflow_dom) is the most direct view: a vertical price ladder with the resting order size stacked at each level — asks above the market, bids below, the spread in the middle. The size column is the content. Heavy resting size is a level a lot of participants are willing to trade at; thin size is a level price slides across easily.
Its strength is precision on the current book and seeing it move — size being pulled as price nears it, size refilling as aggressors eat it, the best bid/offer walking tick by tick. Its limit is that it has no memory: once size clears, the ladder simply shows the new state. The DOM Ladder lesson goes deep on reading it.
Surface 2 — the OrderFlowMap: the book's history
The OrderFlowMap widget (ofm) solves the ladder's blind spot by painting the same book as colour over time. Price runs up the vertical axis, time scrolls left to right, and the resting size at each level is drawn as heat intensity — brighter where more size rests, dark where the book is thin. A large order that sits at one price draws a bright horizontal band; when a band darkens the size was pulled, when one lights up size arrived.
Reading its vocabulary:
- Intensity is resting size. A blazing band is a lot of resting liquidity — a wall — that price would have to consume to pass through.
- Bubbles are executed trades, drawn at the price they printed and sized by how much traded — the aggressive side, shown in context on the resting book.
- CVD (cumulative volume delta) tracks the running sum of taker-buy minus taker-sell aggression, so you can see whether buyers or sellers have been the ones crossing the spread over the session.
Liquidity Heatmaps covers the full reading. One product note: the OrderFlowMap widget is the vendored OrderFlowMap application, fed by Visor's live feed through a bridge. It ships with a fixed feed shape (one-second columns over a fifteen-minute window) — there is no per-instance window control yet.
Surface 3 — the Bookmap: the book over time, at full depth
The Bookmap widget (bookmap) takes the heatmap idea to its deep-work form: an in-house canvas that draws the book over time at up to quarter-second resolution, with buy/sell-split volume bubbles, best-bid/offer lines, CVD and volume-profile sub-charts, detected order-flow events (sweeps, absorption, inferred icebergs, walls appearing and pulling — all labelled as the inferences they are), and a replay transport over the last fifteen minutes. It reads the same live feed as the other surfaces. The Bookmap lesson is its full operating guide; it and OrderFlowMap are deliberately separate widgets — one is a glanceable tile, the other a workbench.
Surface 4 — the chart's footprint and volume delta: flow inside the candle
The first three surfaces are the order book. The chart carries a fourth, complementary view: order flow mapped onto the candles themselves. Turn on the footprint overlay and the Volume Delta indicator (voldelta) from the chart's controls, and each candle is annotated with the taker aggression inside it — how much of the volume printed on the buy side versus the sell side.
- Volume delta is per-candle taker-buy minus taker-sell volume. A green delta bar means aggressive buyers dominated that candle; red means aggressive sellers did. A candle that closes up on negative delta — price rose while sellers were the aggressors — is the kind of imbalance between price and flow that the tape track teaches you to notice.
- The footprint reads the same taker buy/sell series, resampled into the chart's candle interval.
This surface is crypto-only and intraday-only — it covers BTC and ETH on the shortest chart intervals (up to thirty-minute candles), the window where per-candle flow reading is meaningful. On a daily chart or an equity symbol the overlay simply doesn't apply.
The "Try it in Visor" button below opens a five-minute BTC chart with footprint and volume delta already on, so you can see the flow-inside-the-candle view without wiring it up.
The honest frame
Order flow is a lens, not a signal, and every one of these surfaces carries the same two cautions the tape track hammers on:
- A wall is an order, not a promise. Resting size — the DOM stack, the heatmap band — is all limit orders, every one of which can be cancelled the instant price approaches. A wall that evaporates on contact may have been spoofing, or simply someone changing their mind. The book shows what is offered, not what will fill.
- These views describe, they do not predict. A band that held five times can break on the sixth; a session of positive CVD does not owe you a higher price. Order flow sharpens your read of a level you already have an independent reason to watch. It does not, on its own, tell you which way the next move goes. The Tape in Context is where that discipline gets its full argument.
What to read next
- The DOM Ladder — reading the resting book, level by level.
- Liquidity Heatmaps — the book's history as colour, and the OrderFlowMap view in full.
- Spoofing and Fakes — why a bright wall of liquidity might not be real.